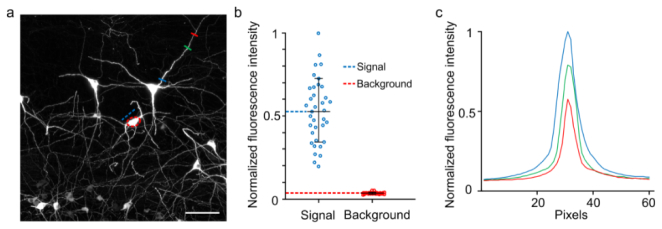
Fig. 8.
Comparison of signal and background fluorescence of the images obtained using successive high-resolution stage-scanning block-face imaging. (a) Maximal intensity projections of the 100-mm thickness z-stacks images without preprocessing. Image stacks were selected from the same data set in Fig. 5. The mean signal intensity was measured from the red dashed circle area. The mean value of the background was measured from a blue dashed line drawn across the background area close to soma. The fluorescent signal intensity was calculated by subtracting the mean value of background from the mean value of the soma. (b) The normalized fluorescent intensities of signal value were compared with background values. 36 somas were measured from different images of the same data set. This result shows that the signal-to-background ratio is 15.1 ± 5.5. (c) Fluorescent intensities of pixels crossed by the blue, green and red lines were plotted in curves with the corresponding color in (a). The signal-to-background ratio values are given as the means ± SD.

