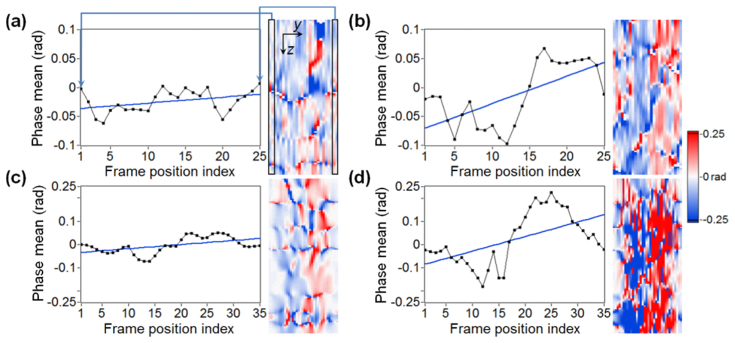
Fig. 7.
Plots of the phase-based differential parameter Slope; a) a horizontal profile through the experimentally acquired RBC signal; the blue line indicates a linear fit; b) a profile through the WBC signal plus linear fit; (c-d) simulated RBC and WBC profiles with linear fits. The black frame on the phase gradient ROI shown in (a) indicates the values used to calculate the first or last sample in the plot on the left. The label ‘Phase mean’ in the plots refers to the mean, taken over a rectangular frame, of phase gradient calculated for different positions of the frame.

