Fig. 13.
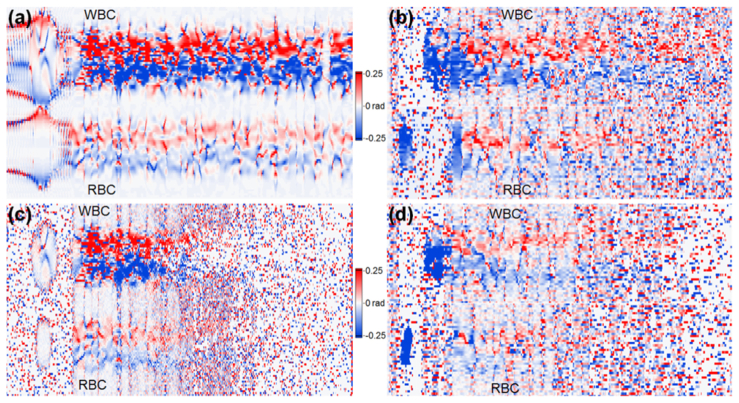
Simulated and experimental phase gradient M-scans; a) a simulated phase gradient M-scan corresponding with the M-scans depicted in Fig. 11(a) and Fig. 12(a); b) an experimental phase gradient M-scan corresponding with the M-scan of Fig. 11(c) (data set 1); c) a simulated phase gradient M-scan with noise added, derived directly from data shown as magnitude in Fig. 11(e) and Fig. 12(e); d) an experimental phase gradient M-scan corresponding with the M-scan of Fig. 12(g) (data set 2).

