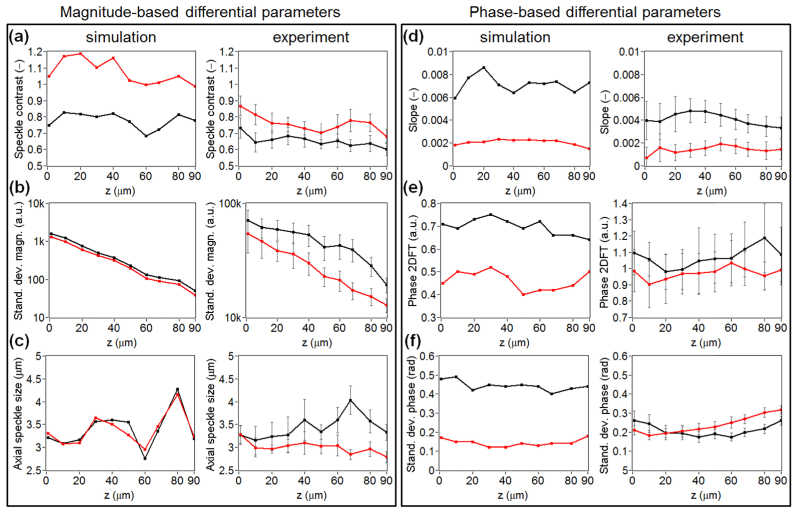
Fig. 16.
Plots illustrating the sensitivity of the differential parameters to axial position of the ROI, calculated for simulated (the left column in each frame) and exemplar experimental data (the right columns), which consists of 130 RBC signals and 130 WBC signals, derived from experimental data set 2. The parameter values shown in row (b) in the left frame are presented in logarithmic scale. The red line in each plot indicates differential parameters obtained for the RBC signals, while the black line corresponds to the WBCs.

