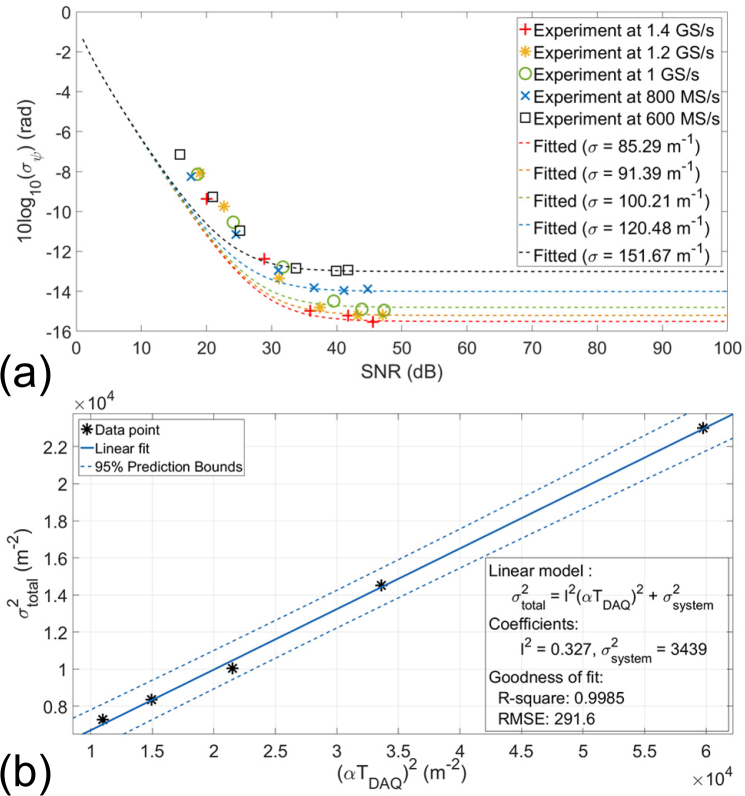
Fig. 3.
The phase performance calibration. The variance of the phase measured at the mirror (zN =150 μm) was examined (a) at different sampling rate, and the data was fitted by using the phase noise model in [18]. (b) The experimental data was fitted again to obtain the system parameter such as the “scanning variability”, and “timing jitter”.

