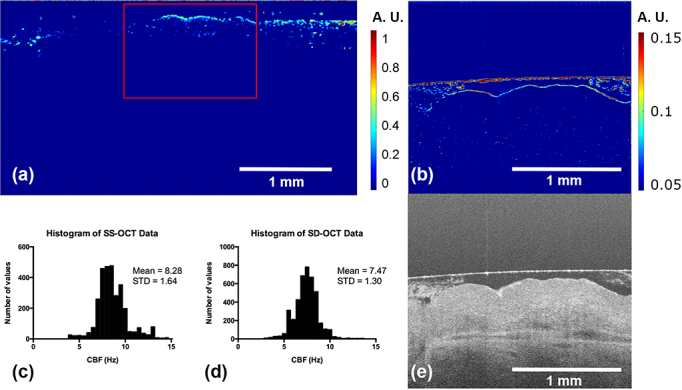
Fig. 7.

Side-by-side comparison on speckle variance images taken from the SS-OCT system and UHR SD-OCT system. (a) Speckle variance image from SS-OCT, and (b) from UHR SD-OCT. The red-boxed region in (a) indicates approximately the same field-of-view as that in (b). The histogram of CBFs measured by (c) SS-OCT and (d) UHR SD-OCT from the same cross-section. The structural image of the same cross-section taken by UHR SDOCT is given in (e) for reference.
