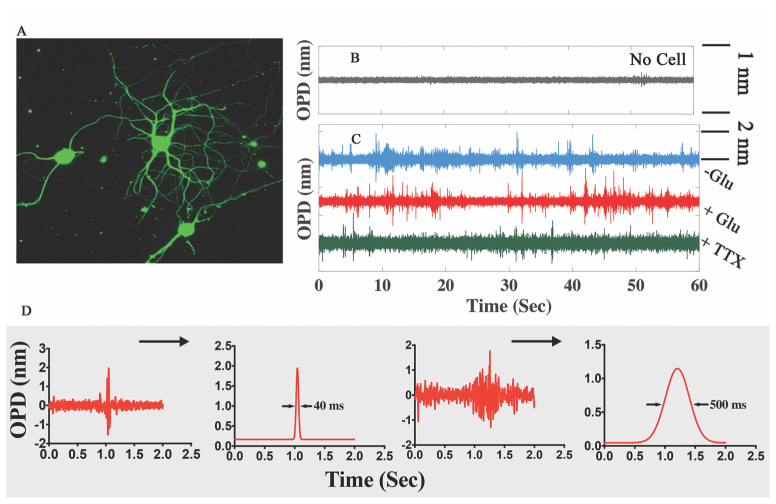
Fig. 2.
Representative optical signals recorded from individual neurons in a network. (A) Fluorescence immuno-stained (primary β-III-tubulin antibody- Alexa Fluor 488) image of networked rat cortical neurons used in our experiments. (B) & (C) Temporal change in OPD under different experimental conditions (no cell, cell without any stimulation, cell with Glutamate stimulation, cell with TTX inhibition) showing a non-periodic train of optical signal oscillation from unstimulated and stimulated neurons which die out when inhibited with TTX. Calculated OPD sensitivity (standard deviation of optical trace in (Fig. 2(B))) was 30 pm. (D) Isolated burst of individual optical pulses that have wave packet like signal pulse characteristics and their corresponding envelopes show variation in temporal pulse width.

