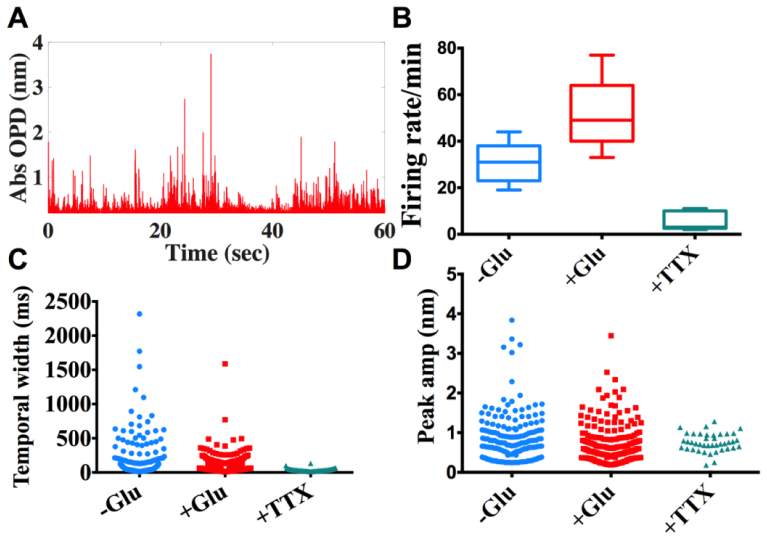
Fig. 4.
Analysis of extracted features from individual optical pulse (Fig. 2) (N = 5 neurons). (A) Optical signals are rectified, followed by envelope detection of each pulse. (B) Firing rate of unstimulated vs stimulated/inhibited neurons, (p<0.05 for -Glu vs + Glu and -Glu vs + TTX). (C)-(D) scatter plots of envelope width, envelope peak under no stimulation, Glutamate stimulation, and TTX inhibition conditions, respectively.

