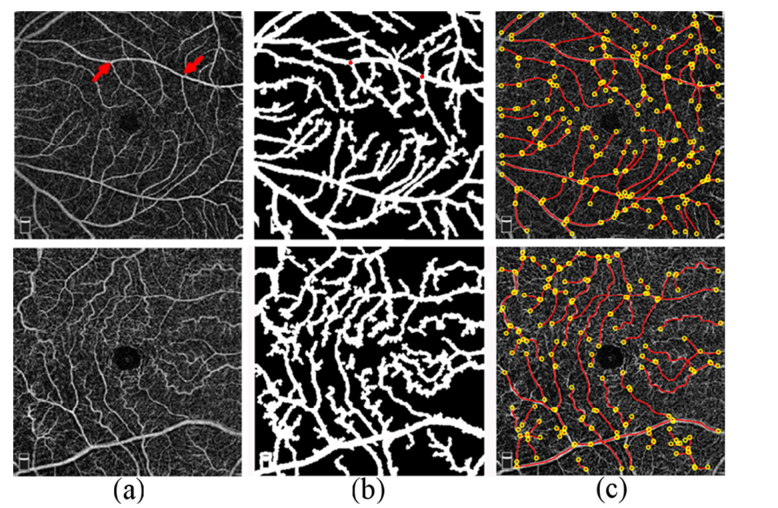
Fig. 3.
(a) OCTA images acquired in a NC (top row) and SCR (bottom row) subject in perifoveal regions. Example of a vessel segment endpoints is shown with red arrows (a; top row) (b) Vessel segmentation using k-means clustering. Example of a vessel segment endpoints selected on the binary image for centerline extraction are shown by red dots (b; top row). (c) Vessel endpoints (yellow circles) and centerlines (red lines) for VTI assessment. Mean VTI in the perifoveal region in the NC and SCR subjects were 0.41 and 0.71, respectively.

