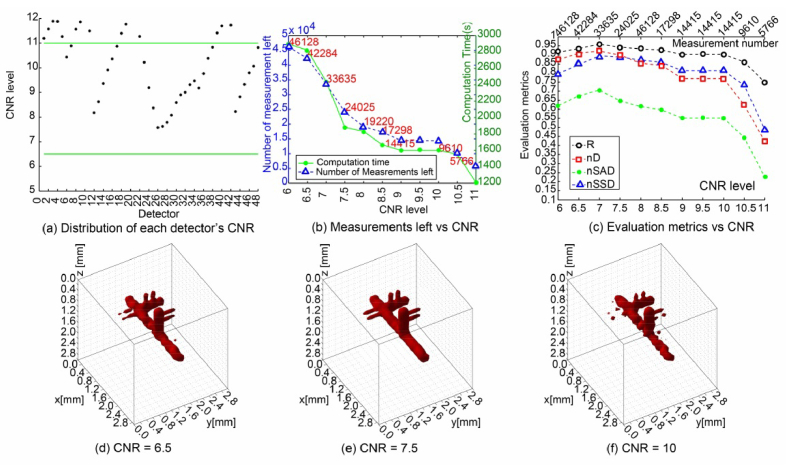
Fig. 6.
Reconstruction results and evaluation metrics under CNR-based data reduction strategy. (a) gives the distribution of the 48 detectors’ CNR level in a case scenario. (b) plots the computation time and measurements left corresponding to different thresholds of CNR. (c) plots the 4 metrics versus different thresholds of CNR. (d)-(f) show 3 visual reconstructions with retained measurements after filtering by the specific CNR threshold of 6.5, 7.5, and 10, respectively.

