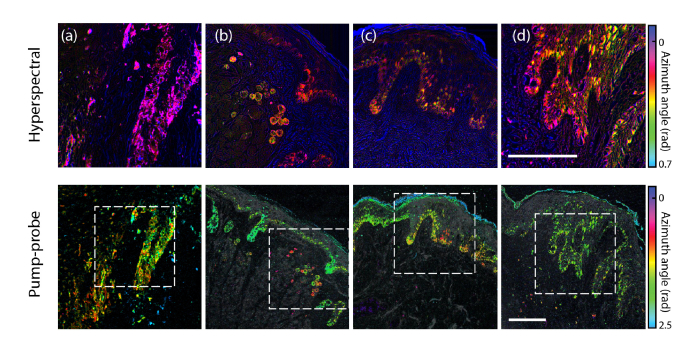
Fig. 2.
Representative false-color images rendered from angular projection PC analysis of both hyperspectral (top) and pump-probe images (bottom, with confocal reflectance overlaid in grayscale): (a, b) invasive cutaneous melanoma, (c, d) normal. Scale bars 100 µm. Dashed boxes: hyperspectral image field of view.

