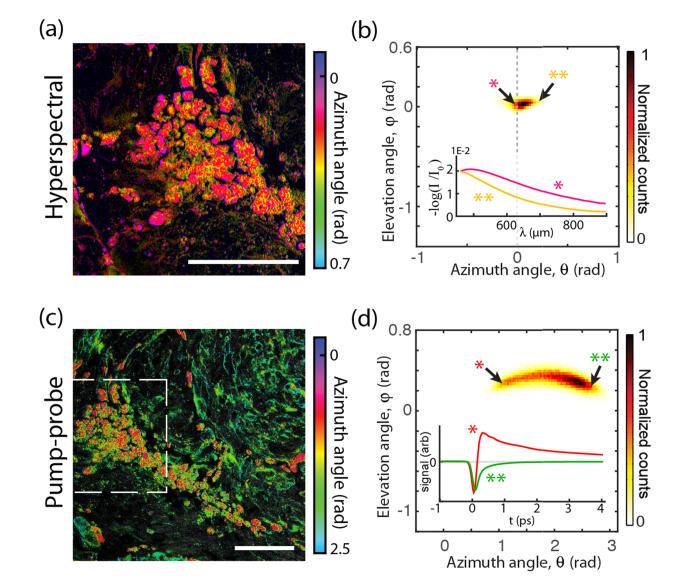
Fig. 3.
Invasive cutaneous melanoma. (a, c) False-color images. Scale bars 100 µm Dashed box: hyperspectral image field of view. (b, d) pigment histograms and representative hyperspectral and pump-probe response curves. In the histograms, markers * and ** indicate points in principal component space at the extrema of the distributions. Corresponding spectra and pump-probe responses are labeled by * and **.

