
Fig. 4.
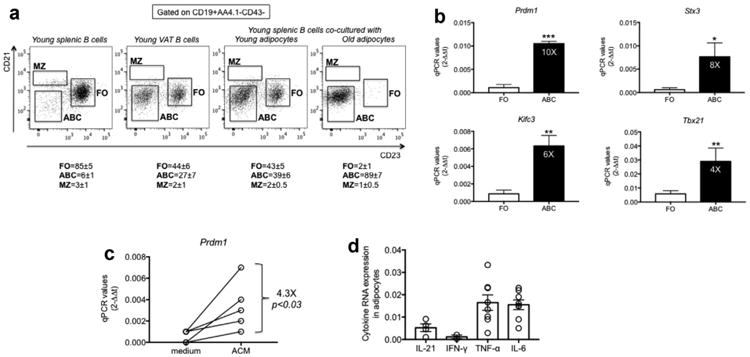
Induction of pro-inflammatory B cell subsets by co-culture of splenic B cells with adipocytes. A. B cells from the spleen and VAT of young mice were isolated and stained as in Fig. 2 to evaluate the relative percentages of FO, ABC, MZ. Adipocytes were isolated from the VAT of young and old mice and cultured for 72 h in transwells with splenic B cells from young mice. After this time, B cells were stained as indicated above and the percentages of the major B cell subsets measured by flow cytometry. Mice are different from those in previous Figs. Numbers below each graph represent percentage (means ± SE) from 4 independent experiments. Percentages of ABC in the VAT of old mice were 49,57,66,58. Splenocytes cultured for 72 h without adipocytes showed a profile similar to the left panel (not shown). B. FO and ABC were sorted from the spleens of old mice, mRNA extracted and qPCR performed. Results show qPCR values (2−ΔΔCt) of Prdm1, Tbx21, Kifc3, Stx3 mRNA expression. Mean comparisons between groups were performed by Student's t-test (two-tailed). *p<0.05, **p< 0.01, ***p< 0.001. C. Splenic FO B cells sorted as described in B were cultured for 48 h in the presence of complete RPMI or ACM at the concentration of 106/ml. The mRNA was harvested from the cultured cells, mRNA extracted and qPCR performed to evaluate mRNA expression of Prdm1. Results show qPCR values (2−ΔΔCt) of Prdm1 mRNA expression. Mean comparisons between groups were performed by Student's t-test (two-tailed). D. Adipocytes were isolated from the VAT of old mice. The mRNA was extracted and qPCR performed. Results, from 4 independent experiments (IL-21 and IFN-γ) or from 8 independent experiments (TNF-α and IL-6), show qPCR values (2−ΔΔCt) of cytokine mRNA expression.