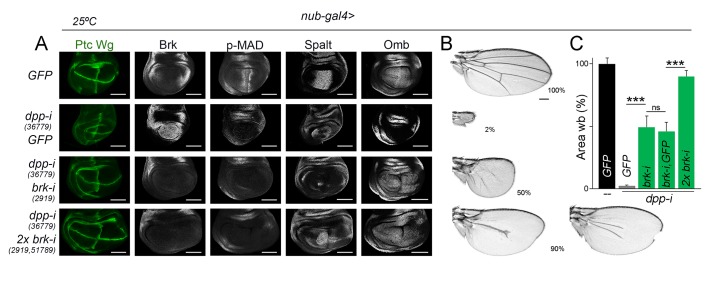
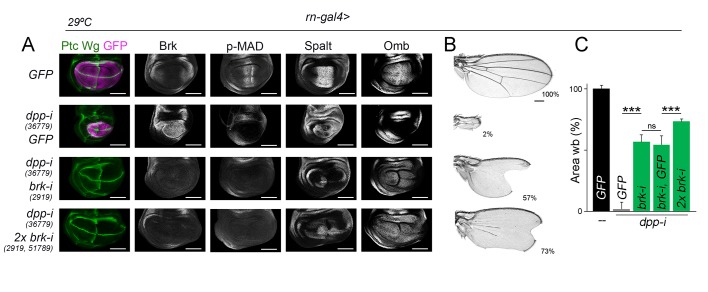
Figure 8. Wing growth in the absence of graded activity of Dpp.
(A) Late third instar wing discs of the indicated genotypes, and stained for Wg and Ptc (green), and Brk, p-MAD, Spalt and Omb (grey). Scale bars, 100 µm. (B) A series of cuticle preparations of male adult wings of the indicated genotypes. Percentages of wing size with respect to control GFP-expressing wings are indicated. Scale bars, 300 µm. (C) Histograms plotting tissue size of adult wing blades (wb) carrying the indicated transgenes and the nub-gal4 driver, and normalized as a percent of the GFP-expressing control wings. Error bars show standard deviation. Number of wings per temperature = 17–30. ***p<0.001; ns, not significant. Individuals were grown at 25°C.
DOI: http://dx.doi.org/10.7554/eLife.22013.023


