. 2017 Jul 25;6:e28131. doi: 10.7554/eLife.28131

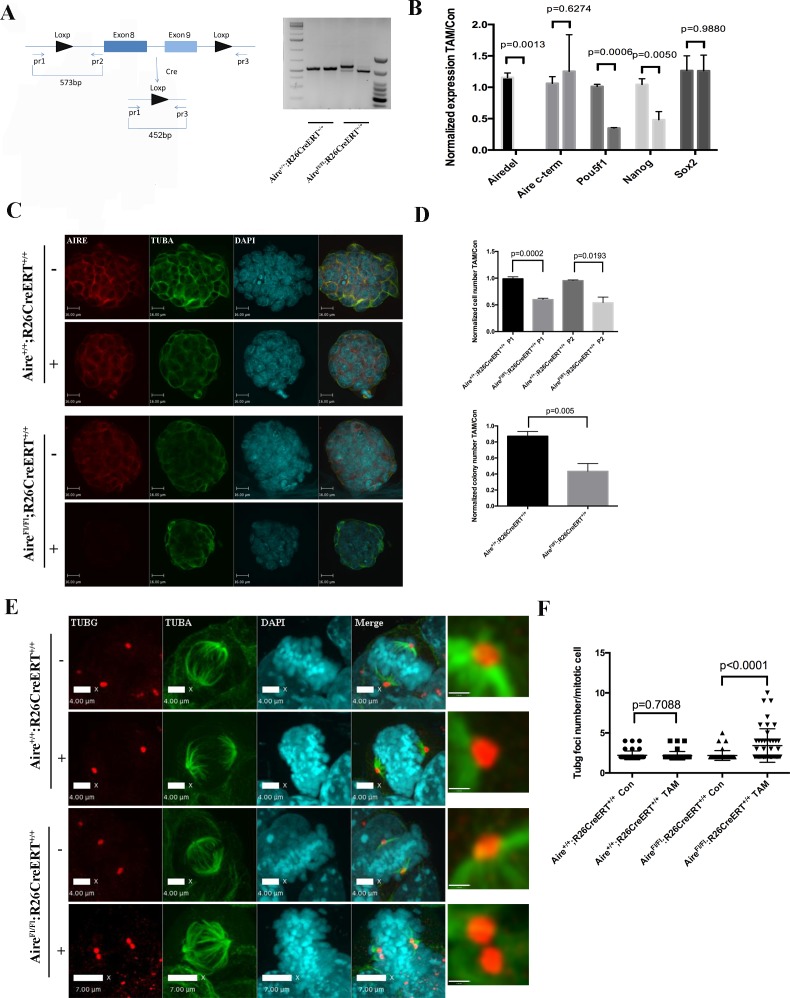
Figure 3. Aire is essential for spindle assembly in ES cells.

(A) Scheme of the AireFl allele and genotyping strategy before and after cre-induced deletion. Genotyping results from Aire+/+R26CreERT+/+ and AireFl/Fl R26CreERT+/+ ES cells without tamoxifen (-) and with 5 ng/ml tamoxifen for 24 hr (+). (B) qPCR analysis of gene expression at passage one after tamoxifen treatment in Aire+/+R26CreERT+/+ and AireFl/Fl R26CreERT+/+ ES cells. Aire del: primers complementary to deleted region of Aire. Aire c-term: primers complementary to c-terminal region of Aire. Data presented as mean ± sd of 3 biological replicates. p-values were calculated with Wilson’s t-test. (C) Validation of Aire knockout by immunofluorescence imaging in Aire+/+R26CreERT+/+ and AireFl/Fl R26CreERT+/+ ES cells without tamoxifen (-) and with 5 ng/ml tamoxifen for 24 hr (+). bar: 16 μm. (D) Proliferation over two passages and colony formation assay showing total cell number (top panel) and ALP positive colony number (bottom panel) in tamoxifen treated over non-treated Aire+/+R26CreERT+/+ and AireFl/Fl R26CreERT+/+ ES cells. Data in each panel presented as mean ± sd of 3 biological replicates. p-values were calculated with Wilson’s t-test. (E) Representative immunofluorescence images of γ-tubulin (TUBG) foci on mitotic spindles in passage 1 Aire+/+R26CreERT+/+ and AireFl/Fl R26CreERT +/+ ES cells without tamoxifen (-) and with 5 ng/ml tamoxifen for 24 hr (+). Scale bar: 4 μm. Right column shows magnified views of spindle poles. Scale bar: 1 μm. (F) Quantitation of γ-tubulin (TUBG) foci on mitotic spindles in passage 1 Aire+/+R26CreERT+/+ and AireFl/Fl R26CreERT+/+ ES cells without tamoxifen (Con) and with 5 ng/ml tamoxifen for 24 hr (TAM). γ-tubulin (TUBG) foci were counted from 30 mitotic cells from three biological replicates for each group. Each point represents one mitotic cell. Error bars: s.d. of mean. p-values were calculated with Mann–Whitney–Wilcoxon test.

DOI: http://dx.doi.org/10.7554/eLife.28131.010

Figure 3.

Figure 3—figure supplement 1. Complete diagram of Aire floxed (Fl) allele and cre induced depletion of critical exons.

Figure 3—figure supplement 1.

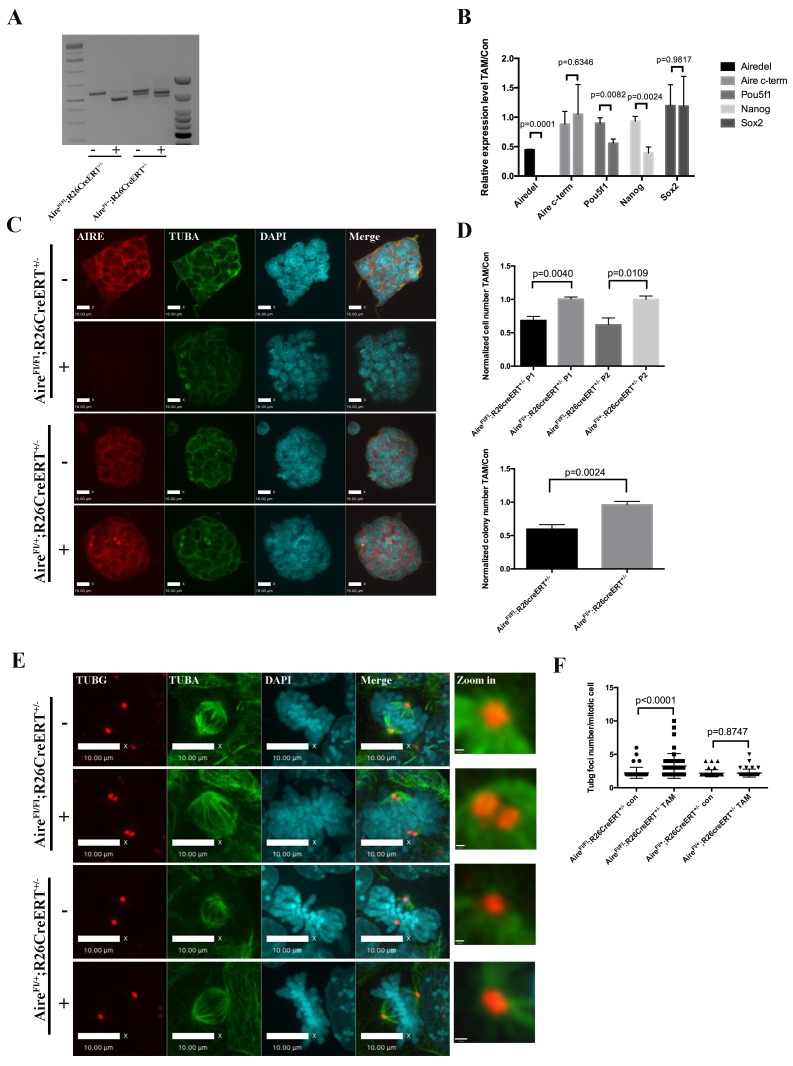
Figure 3—figure supplement 2. Aire knockout abrogated proliferation and spindle assembly in Pair 2 ES cells.

Figure 3—figure supplement 2.

(A) Genotyping results from Aire Fl/Fl R26CreERT ± and AireFl/+R26CreERT ± ES cells without tamoxifen (-) and with 20 ng/ml tamoxifen for 24 hr (+). (B) qPCR analysis of gene expression at passage one after tamoxifen (TAM) treatment in Aire Fl/Fl R26CreERT ± and AireFl/+R26CreERT ± ES cells. Aire del: primers complementary to deleted region of Aire. Aire c-term: primers complementary to c-terminal region of Aire. Data presented as mean ± sd of 3 biological replicates. p-values were calculated with Wilson’s t-test. (C) Validation of Aire knockout by immunofluorescence imaging in Aire Fl/Fl R26CreERT ± and AireFl/+R26CreERT ± ES cells without tamoxifen (-) and with 20 ng/ml tamoxifen for 24 hr (+). Scale bar: 16 μm. (D) Proliferation over two passages and colony formation assay showing total cell number (top panel) and ALP positive colony number (bottom panel) in tamoxifen treated over non-treated (TAM/Con) Aire Fl/Fl R26CreERT ± and AireFl/+R26CreERT ± ES cells. Data in each panel presented as mean ± sd of 3 biological replicates. p-values were calculated with Wilson’s t-test. (E) Representative immunofluorescence images of γ-tubulin (TUBG) foci on mitotic spindles in passage 1 Aire Fl/Fl R26CreERT ± and AireFl/+R26CreERT ± ES cells without tamoxifen (-) and with 20 ng/ml tamoxifen for 24 hr (+). Scale bar: 10 μm. Right column shows magnified view of spindle poles. Scale bar: 0.5 μm. (F) Quantitation of γ-tubulin (TUBG) foci on mitotic spindles in passage 1 Aire Fl/Fl R26CreERT ± and AireFl/+R26CreERT ± ES cells without tamoxifen (Con) and with 20 ng/ml tamoxifen for 24 hr (TAM). γ-tubulin (TUBG) foci were counted from 30 mitotic cells from three biological replicates for each group. Each point represents one mitotic cell. Error bars: s.d. of mean. p-values were calculated with Mann–Whitney–Wilcoxon test.
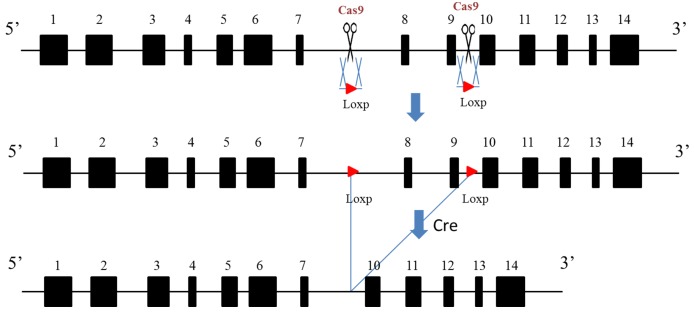
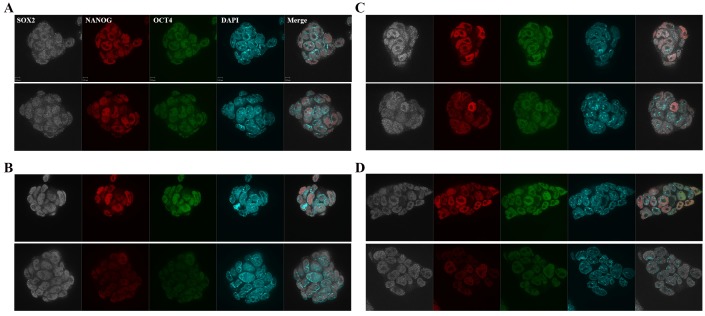
Figure 3—figure supplement 3. Immunofluorescence images of pluripotency markers in Aire Floxed;R26CreERT cells.

Figure 3—figure supplement 3.

Scale bar: 1 μm. (A) Aire+/+R26CreERT+/+: Upper: Con; Bottom: TAM. (B) AireFl/Fl R26CreERT +/+: Upper: Con; Bottom: TAM. (C) AireFl/+R26CreERT+/-: Upper: Con; Bottom: TAM. (D) Aire Fl/Fl R26CreERT+/-: Upper: Con; Bottom: TAM.