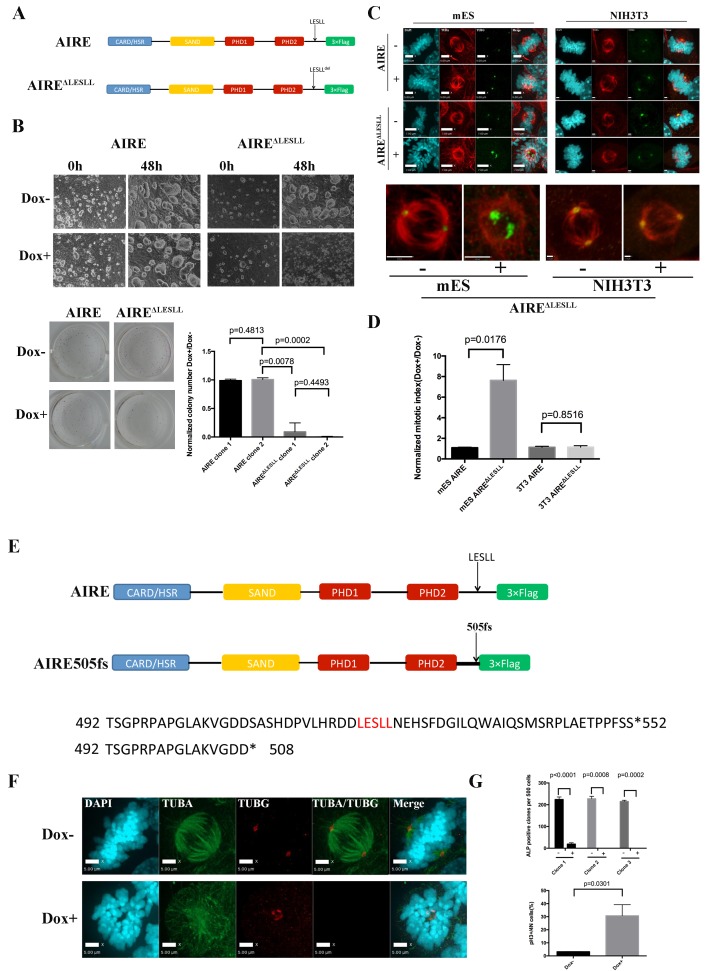
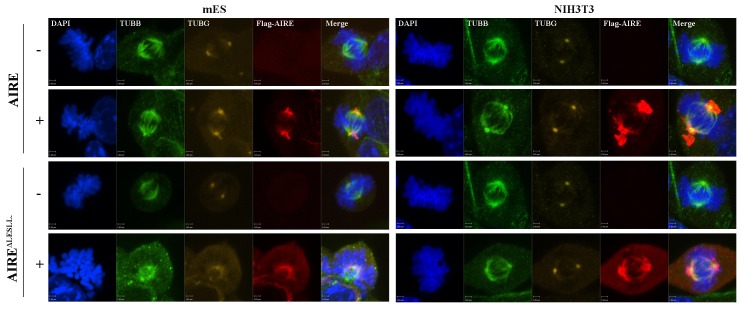
Figure 4. The last LxxLL(LESLL) motif is essential for the mitotic functions of Aire in ES cells.
(A) Diagram showing Aire and Aire ΔLESLL transgene structures. (B) Characterization of proliferation and colony formation of ES cells upon doxycycline-induced overexpression of AIRE or AIREΔLESLL. Representative bright field images of ES cell cultures 48 hr after doxycycline induction from three biological replicates (top panel). Representative images (bottom left panel) and quantification (bottom right panel) of ALP-stained colonies of AIRE or AIRE ΔLESLL-overexpressing ES cells 3 days after seeding. Quantification of ALP positive colonies was done from two independent clones for each transgene and normalized to Dox- controls. Data presented as mean ± sd of 3 biological replicates. p-values were calculated with Wilson’s t-test. (C) Immunofluorescence staining of spindles in control (Dox-) and AIRE or AIRE ΔLESLL-overexpressing (Dox+) ES cells (left panel) and NIHT3T cells (right panel). Scale bar: 7 μm. Magnified images of spindles from AIRE ΔLESLL-overexpressing groups. Scale bar: 4 μm. (D) Mitotic index (number of cells in mitosis in Dox+/Dox- conditions) of AIRE and AIRE ΔLESLL-overexpressing ES cells and NIH3T3 cells. Number of cells in mitosis was determined by flow analysis for PI-4N/pH3 markers. Data presented as mean ± sd of 3 replicates. p-values were calculated with Wilson’s t-test. (E) Diagram showing domain structure and partial amino acid sequence of human AIRE and AIRE505fs. (F) Immunofluorescence staining of spindles in control (Dox-) and AIRE505fs-overexperssing (Dox+) ES cells. Scale bar: 5 μm. (G) Characterization of colony formation and mitotic index of ES cells upon doxycycline-induced overexpression of Aire505fs. Top panel: number of ALP-positive colonies per well analyzed for 3 AIRE505fs transgenic ES cell clones without (Dox-) and with (Dox+) addition of doxycycline. Data presented as mean ± sd of 3 biological replicates for each clone, p-values were calculated with Wilson’s t-test. Bottom Panel: percent of cells in mitosis in control (Dox-) and AIRE505fs overexpressing (Dox+) ES cells. Number of cells in mitosis was determined by flow analysis for PI-4N/pH3 markers (bottom panel). Data presented as mean ± sd of 3 replicates. p-values were calculated with Wilson’s t-test.


