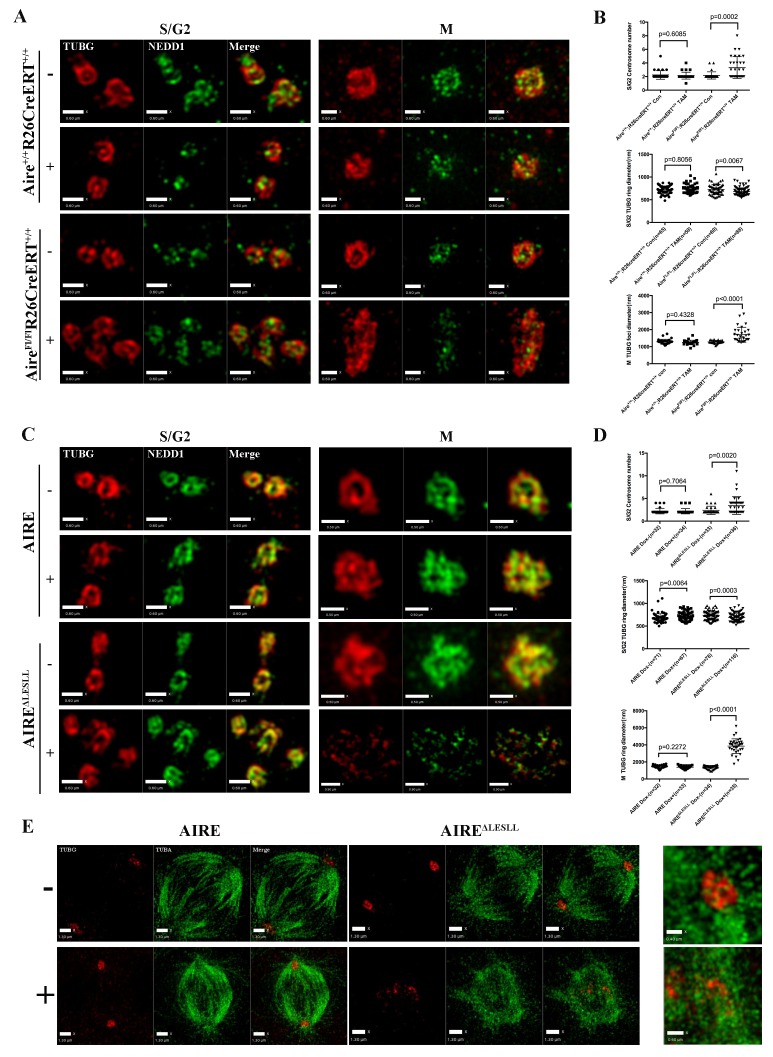
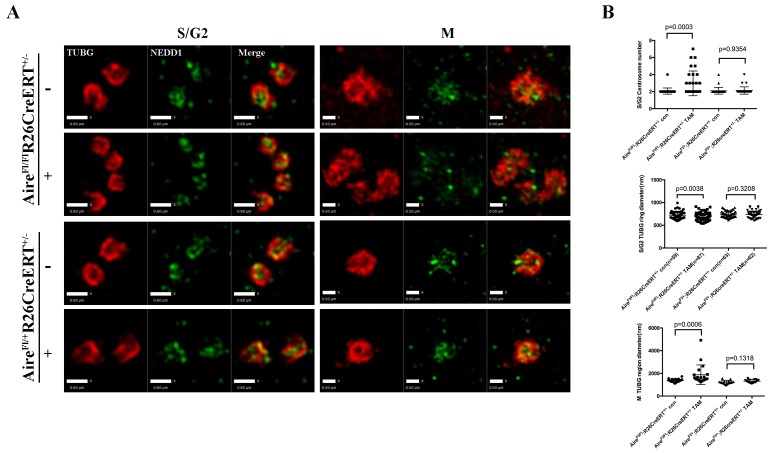
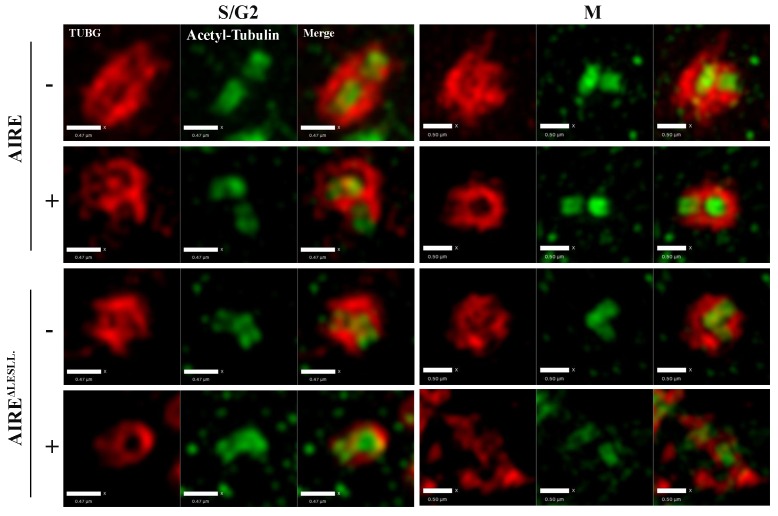
Figure 5. Aire is critical for centrosome number sustenance and the integrity of mitotic spindle poles.
(A) Representative immunofluorescence SIM images of γ-tubulin (TUBG) and NEDD1 in control (Aire+/+;R26CreERT+/+ tamoxifen-/+and AireFL/FL;R26CreERT+/+ tamoxifen-) and Aire-/- (AireFL/FL;R26CreERT+/+ tamoxifen +) mES cells during S/G2 and M phases of the cell cycle. Scale bar: 0.7 μm. (B) Quantification of centrosome parameters in control and Aire-/- ES cells (groups same as in panel (A)). Centrosome number in 30 S/G2 cells (top panel) from three biological replicates were counted for each group, mean ± sd is shown. Each point represents one mitotic cell. p-values were calculated with Mann–Whitney–Wilcoxon test. γ-tubulin(TUBG) ring diameter in S/G2 cells (middle panel). Each point represents one centrosome. Mean ± sd was presented. p-values were calculated with Mann–Whitney–Wilcoxon test. γ-tubulin(TUBG) foci diameter in M phase cells (bottom panel). 30 spindle poles from three biological replicates were quantified for each group. Each point represents one spindle pole. Mean ± sd is presented. p-values were calculated with Mann–Whitney–Wilcoxon test. (C) Representative immunofluorescence SIM images of γ-tubulin (TUBG) and NEDD1 in control (Dox-) and AIRE or AIRE ΔLESLL-overexpressing mES cells (Dox+) during S/G2 and M phases of the cell cycle. Scale bar: S/G2 Figure 0.6 μm; M images in top three panels 0.5 μm, and bottom panel 0.9 μm. (D) Quantification of centrosome parameters in AIRE or AIRE ΔLESLL-overexpressing mES cells (groups same as in panel (C)) Centrosome number in S/G2 cells (top panel). Each point represents one mitotic cell. Mean ± sd is presented. p-values were calculated with Mann–Whitney–Wilcoxon test. γ-tubulin (TUBG) ring diameter in S/G2 cells (middle panel). Each point represents one centrosome. Mean ± sd was presented. p-values were calculated with Mann–Whitney–Wilcoxon test. γ-tubulin(TUBG) diameter in M phase cells(bottom panel). Each point represents one spindle pole. Mean ± sd is presented. p-values were calculated with Mann–Whitney–Wilcoxon test. (E) Representative immunofluorescence SIM images of spindles and MOTCs (γ -tubulin and α-tubulin) in control (Dox-) and AIRE or AIRE ΔLESLL-overexpressing mES cells (Dox+) during M phase. Scale bar: 1.3 μm. Magnified view of MTOC in AIRE ΔLESLL (Dox-) (top scale bar: 0.6 μm) and AIREΔLESLL (Dox+) (bottom scale bar: 0.4 μm).


