. 2017 Jul 25;6:e28131. doi: 10.7554/eLife.28131

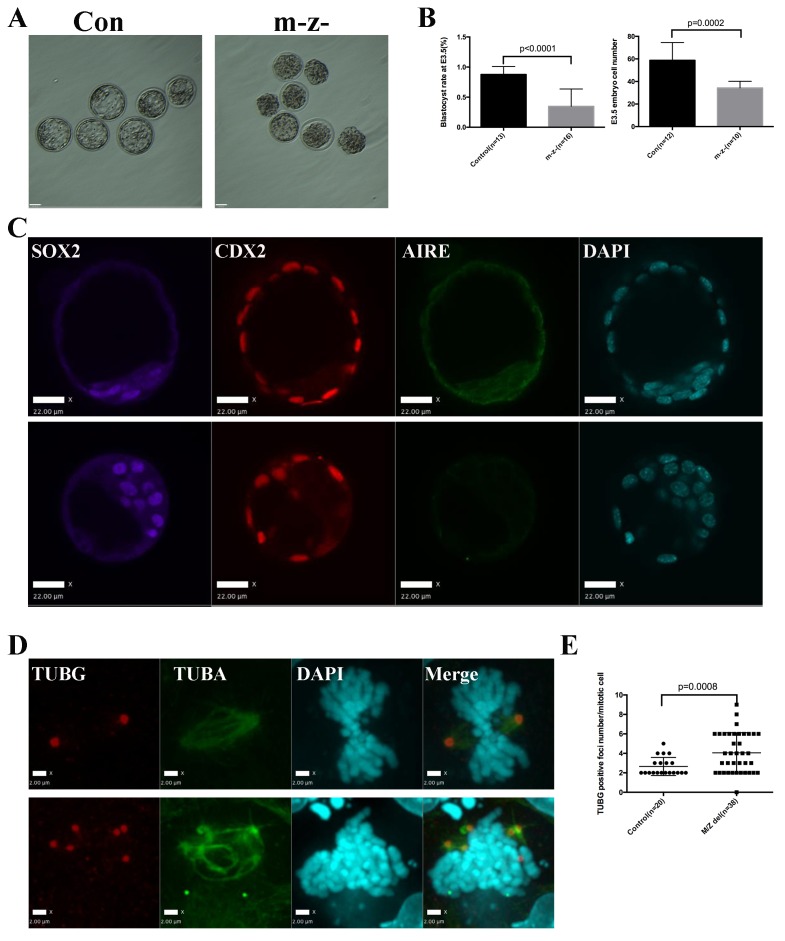
Figure 6. Aire m-/z- preimplantation embryos showed proliferation delay and spindle defects.

(A) Brightfield images of control (Con) and Aire m-/z- embryos at embryonic day (E) 3.5. (B) Quantification of blastocyst-formation rate (left panel) and cell number at E3.5 (right panel) in control (Con) and Aire m-/z- embryos. Data is presented as mean ± sd. p-values were calculated with Wilson’s t-test. (C) Immunofluorescence staining for Aire in control (Con) (upper) and Aire m-/z- (down) E3.5 embryos. Scale bar: 22 μm. (D) Representative immunofluorescence image of spindles (γ –tubulin (TUBG), α-tubulin (TUBA)) in E3.5 control (Con) (top) and Aire m-/z- (bottom) embryo cells. Scale bar: 2 μm. (E) Quantification of γ –tubulin (TUBG) positive foci per mitotic cell in control and Aire m-/z- embryos. Each point represents one mitotic cell. Mean ± sd is presented. p-values were calculated with Wilson’s t-test.

DOI: http://dx.doi.org/10.7554/eLife.28131.020

Figure 6.

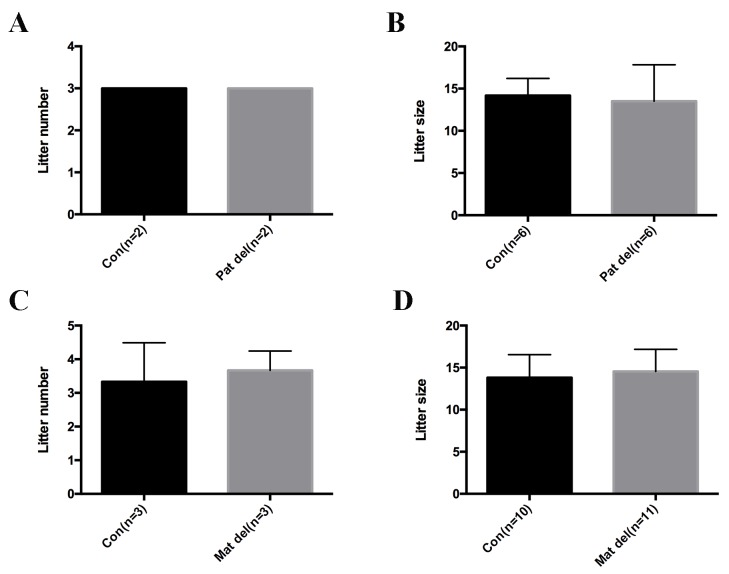
Figure 6—figure supplement 1. No obvious infertility phenotype was observed in paternal or maternal Aire knockout mice.

Figure 6—figure supplement 1.

Data presented as mean ± sd. (A) Litter numbers produced in 3 months in control and paternal Aire knockout mice. (B) Litter sizes produced in 3 months in control and paternal Aire knockout mice. (C) Litter numbers produced in 3 months in control and maternal Aire knockout mice. (D) Litter sizes produced in 3 months in control and maternal Aire knockout mice.
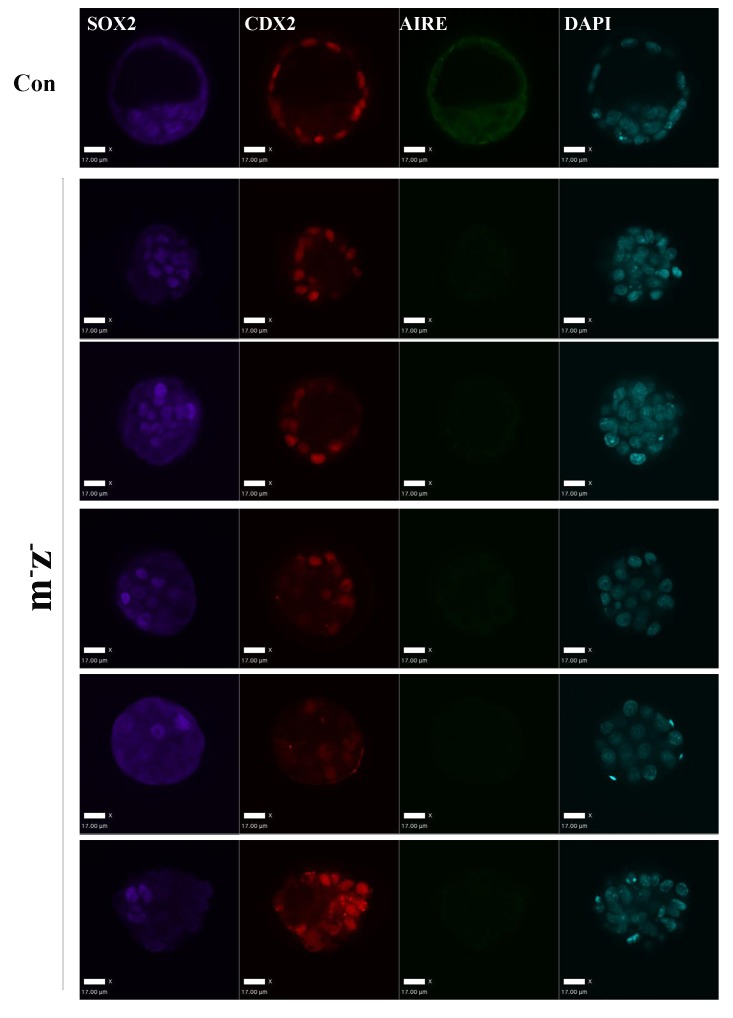
Figure 6—figure supplement 2. Aire m- z- embryos didn’t show obvious early lineage defects.

Figure 6—figure supplement 2.

Representative immunofluorescence images of control (Con) and Aire m- z- E3.5 embryos for the epiblast marker SOX2, a trophectoderm marker CDX2 and AIRE. Legends for supplementary files.