. 2017 Jul 20;6:e26036. doi: 10.7554/eLife.26036

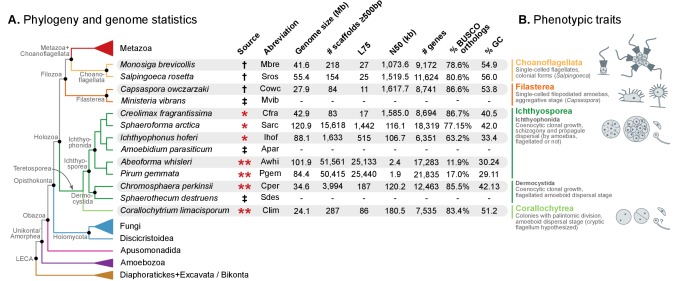
Figure 1. Evolutionary framework and genome statistics of the study.

(A) Schematic phylogenetic tree of eukaryotes, with a focus on the Holozoa. The adjacent table summarizes genome assembly/annotation statistics. Data sources: red asterisks denote Teretosporea genomes reported here; double asterisks denote organisms sequenced for this study; † previously sequenced genomes (King et al., 2008; Fairclough et al., 2013; Suga et al., 2013); ‡ organisms for which transcriptomic data exists but no genome is available (Torruella et al., 2015). (B) Overview of the phenotypic traits of each group of unicellular Holozoa, focusing on their multicellular-like characteristics. For further details, see (Torruella et al., 2015; Mendoza et al., 2002; Marshall et al., 2008; Glockling et al., 2013). Figure 1—source data 1 and 2.

DOI: http://dx.doi.org/10.7554/eLife.26036.003

Figure 1—source data 1. Table of genome structure statistics, from the data-set of eukaryotic genomes used in the study.
Includes genome size and portion of the genome covered by genes, exons, introns and intergenic regions. Used in Figures 1, 3 and 4.
DOI: 10.7554/eLife.26036.004
Figure 1—source data 2. List of genome and transcriptome assemblies and annotations, including abbreviations, taxonomic classification and data sources.
Used in Figure 1.
DOI: 10.7554/eLife.26036.005

Figure 1.

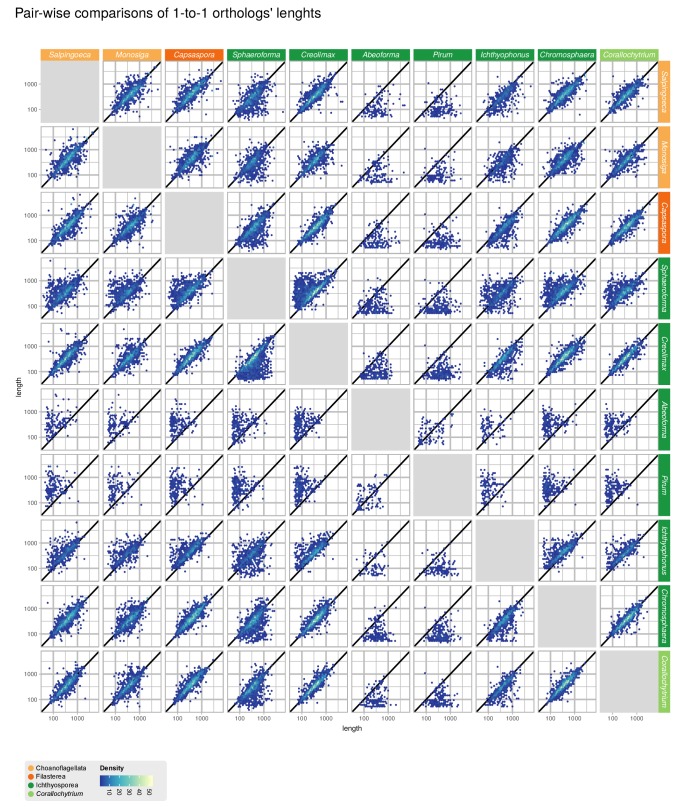
Figure 1—figure supplement 1. Comparisons of gene length of one-to-one orthologs from pair-wise comparisons of all 10 unicellular Holozoa.

Figure 1—figure supplement 1.

Dots around the diagonal lines indicate that orthologs from both organisms have identical lengths. Note that Abeoforma and Pirum have abundant incomplete orthologous sequences.