. 2017 Jul 20;6:e26036. doi: 10.7554/eLife.26036

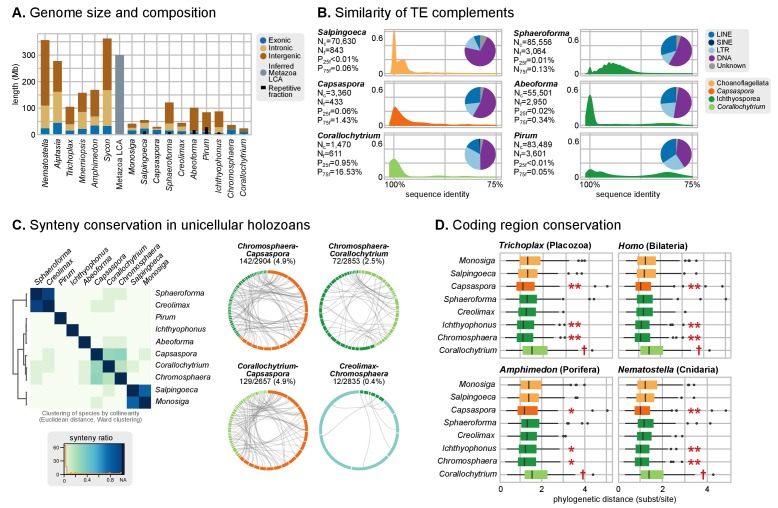
Figure 3. Patterns of genome evolution across unicellular Holozoa.

(A) Genome size and composition in terms of coding exonic, intronic and intergenic sequences of unicellular holozoan and selected metazoans. Percentage of repetitive sequences shown as black bars. Genome size of the Metazoa LCA (gray bar) from (Simakov and Kawashima, 2017) (exonic, intronic and intergenic composition not known). (B) Profile of TE composition for selected organisms. Density plots indicate the sequence similarity profile of the TE complement in each organism. Embedded pie-charts denote the relative abundance, in nucleotides, of the main TE superclasses in each genome: retrotransposons (SINE, LINE and LTR), DNA transposons (DNA) and unknown. Nc: total number TE copies in the genome; Nf: number of families to which these belong; P25f and P75f: percentage of most-frequent TE families that account for 25% and 75% of the total number of TE copies, respectively. (C) Heatmap of pairwise microsynteny conservation between 10 unicellular holozoan genomes. Species ordered according the number of shared syntenic genes (Euclidean distances, Ward clustering). At the right: selected pairwise comparisons of syntenic single-copy orthologs between unicellular holozoan genomes. Numbers denote number of syntenic genes, total number of single-copy orthologs, and proportions (%) of syntenic genes per the compared orthologs. Circle segments are scaffolds sharing ortholog pairs, connected by gray lines. (D) Phylogenetic distances between unicellular holozoans and four selected animals: Homo sapiens, Nematostella vectensis, Trichoplax adhaerens and Amphimedon queenslandica. Red asterisks denote organisms that have lower phylogenetic distances to metazoans than one (single asterisk) or both choanoflagellates (double asterisks) (p value < 0.05 in Wilcoxon rank sum test). † indicates significantly higher distances between Corallochytrium and metazoans. Figure 1—source data 1, Figure 3—source data 1, 2 and 3.

DOI: http://dx.doi.org/10.7554/eLife.26036.010

Figure 3—source data 1. Annotated repetitive sequences from 10 unicellular Holozoa genomes.
Includes transposable elements, simple repeats, low complexity regions and small RNAs. Used in Figure 3.
DOI: 10.7554/eLife.26036.011
Figure 3—source data 2. List of annotated transposable element families in 10 unicellular Holozoa genomes, with copy counts.
Used in Figure 3.
elife-26036-fig3-data2.xlsx (627.4KB, xlsx)
DOI: 10.7554/eLife.26036.012
Figure 3—source data 3. List of annotated transposable element families shared between the genomes of 10 unicellular holozoans and 11 animals, including the number of species where the TE family is present.
Three lists are included: all TE families present in any holozoan, a list restricted to the most abundant TE families accounting for 75% of all copies in each holozoan (P75f statistic; see Figure 3B), and id. for 25% copies (P25f statistic). Used in Figure 3.
elife-26036-fig3-data3.xlsx (591.2KB, xlsx)
DOI: 10.7554/eLife.26036.013

Figure 3.

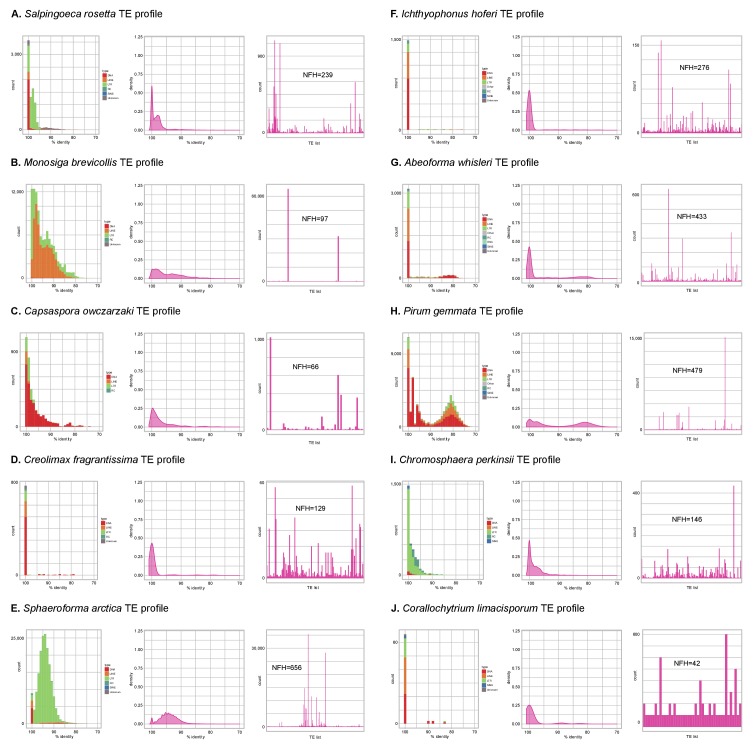
Figure 3—figure supplement 1. Profile of TE composition of unicellular Holozoa.

Figure 3—figure supplement 1.

(A-J) Profile of transposable element (TE) composition of 10 unicellular Holozoa, including (i) distribution of sequence similarity frequencies within the TE complement obtained from BLAST alignments (minimum 70% identity and 80 bp alignment length); (ii) same data but using density-normalized plots; and (iii) raw counts of hits for each TE family, indicating the number of families with hits (NFH) for each species. Each third panel illustrates how TE complements can be biased towards a handful of families with a high number of similarity hits (e.g. Monosiga or Pirum) or, conversely, exhibit even distributions (e.g. Corallochytrium).
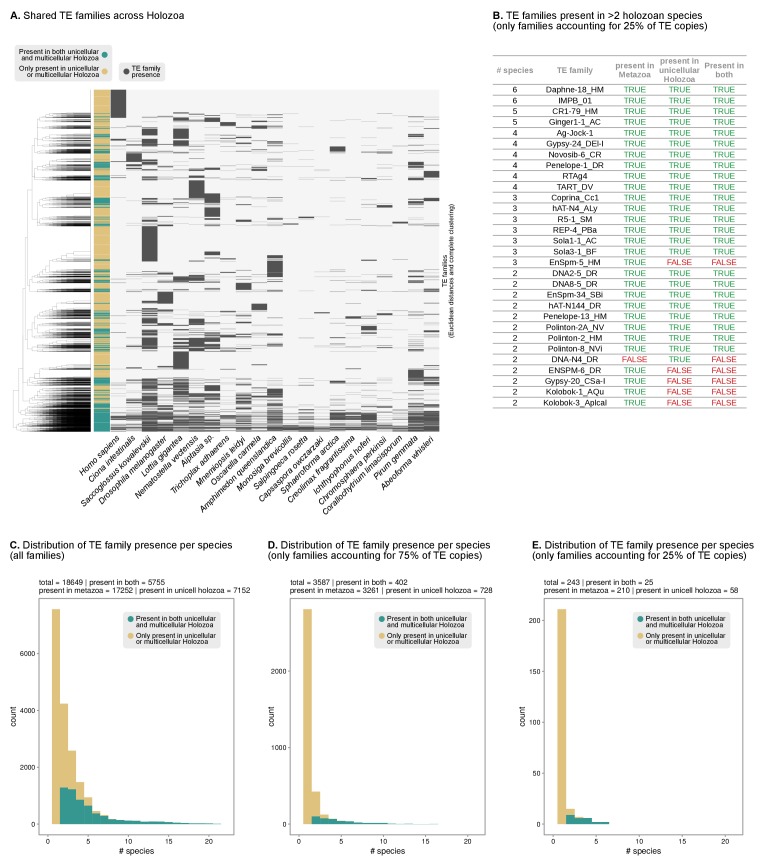
Figure 3—figure supplement 2. Shared TEs between unicellular Holozoa and animal genomes.

Figure 3—figure supplement 2.

(A) Pattern of presence/absence of TE families across Holozoa (11 animals and 10 unicellular holozoans). Dendrogram at the left represents the sorting of TE families by Euclidean distance and Ward clustering. Colored column indicates presence in both unicellular and multicellular holozoans (green) or just on unicellular or multicellular holozoans (light brown). (B) List of the most abundant TE families across holozoans, including only most abundant families present in >1 species and accounting for 25% of the copies in a given genome. Complete table in Figure 3—source data 3. (C–E) Distribution of the number of TE families present in unicellular holozoans per number of species (X axis). The color code indicates presence in both unicellular and multicellular holozoans (green) or just on unicellular or multicellular holozoans (light brown). Panel C includes all TE families; panel D only most abundant TEs accounting for 75% of the copies in a given genome (P75f); panel E id. for 25% of copies (P25f).
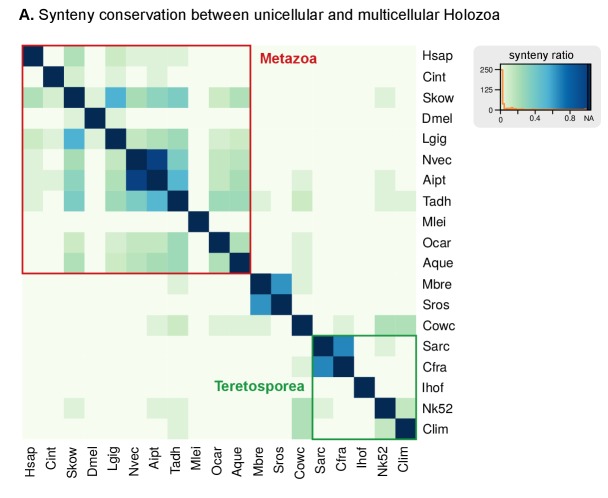
Figure 3—figure supplement 3. Heatmap of pairwise ratios of ortholog collinearity between 10 unicellular holozoan genomes.

Figure 3—figure supplement 3.

Species are manually ordered by taxonomic classification (no clustering).