. 2017 Jul 20;6:e26036. doi: 10.7554/eLife.26036

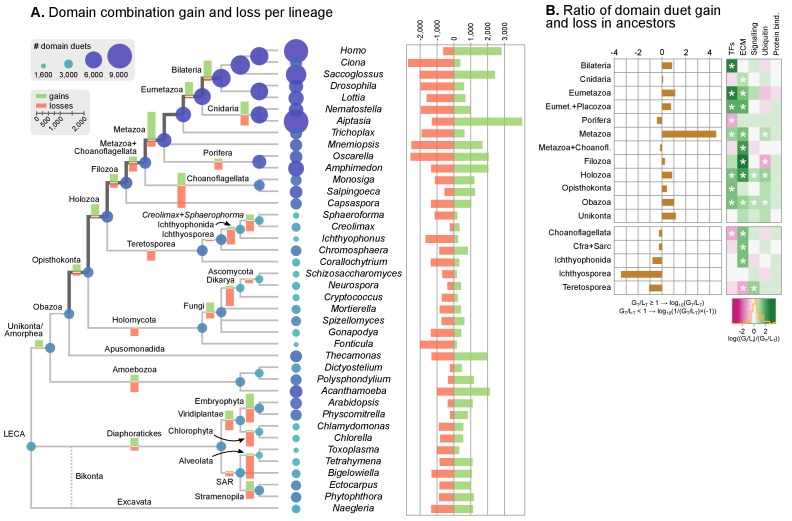
Figure 7. Evolution of protein domain architectures.

(A) Protein domain combination gain and loss per lineage, including extant genomes and ancestral reconstructed nodes. Diameter and color of circles denote the number of different domain combinations (in different gene families) in that node of the tree. Bolder edges mark the line of descent between the LCAs of Opisthokonta and Bilateria, which was generally dominated by gains of protein domain combinations (see text). Red and green bars represent the inferred number of gains and losses, respectively. (B) Gain/loss ratio of protein domain diversity in selected ancestors, including animals (upper chart; from Metazoa to Unikonta/Amorphea) and unicellular holozoans (lower). Heatmap to the right represents the log-ratio value of the diversification rate for selected sub-sets of functionally-related protein domains relevant to multicellularity: green indicates higher-than-average diversification; pink less; white asterisks indicate two-fold or more increases or decreases (all comparisons relative to the whole set of protein domains). Source Data Figure 7—source data 123 and 4.

DOI: http://dx.doi.org/10.7554/eLife.26036.026

Figure 7—source data 1. Rates of gain and loss of protein domain pairs within a given orthogroup for extant and ancestral eukaryotes, calculated for a phylogenetic birth-and-death probabilistic model that accounts for gains, losses and duplications (Csurös, 2010).
Used in Figures 7, 8 and 9.
DOI: 10.7554/eLife.26036.027
Figure 7—source data 2. Reconstruction of the evolutionary histories of protein domain pairs gains within orthogroups, using a phylogenetic birth-and-death probabilistic model that accounts for gains, losses and duplications (Csurös, 2010).
Used in Figures 7, 8, 9 and 10.
DOI: 10.7554/eLife.26036.028
Figure 7—source data 3. Reconstruction of the evolutionary histories of individual protein domains, using Dollo parsimony and accounting for gains and losses (Csurös, 2010).
Used in Figures 7, 8, 9 and 10.
DOI: 10.7554/eLife.26036.029
Figure 7—source data 4. Rates of gain and loss of orthogroups for extant and ancestral eukaryotes, using a phylogenetic birth-and-death probabilistic model that accounts for gains, losses and duplications.
Used in Figures 1.
DOI: 10.7554/eLife.26036.030

Figure 7.

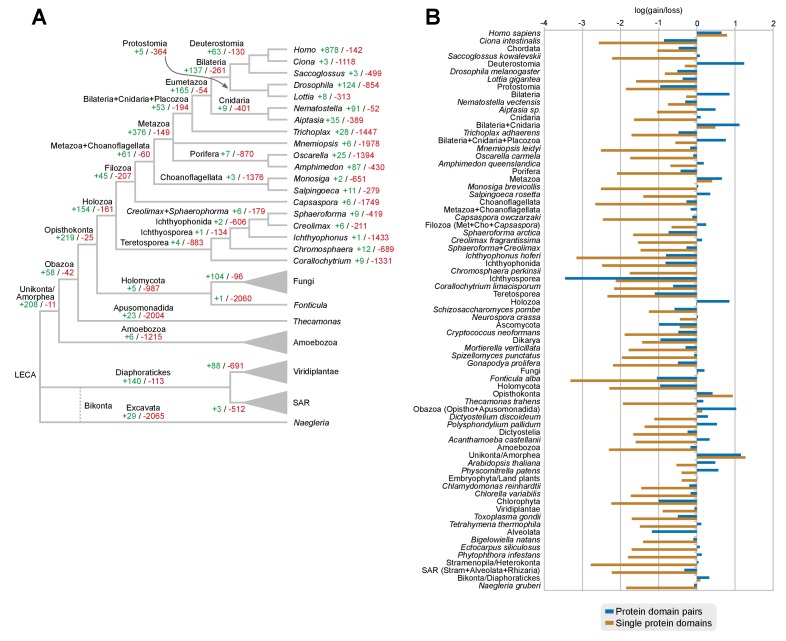
Figure 7—figure supplement 1. Gains and losses of individual protein domains across eukaryotes.

Figure 7—figure supplement 1.

(A) Ancestral reconstruction of gains (green) and losses (red) of protein domains per lineage, based on Dollo parsimony. Note that, in contrast with the evolution of protein domain combinations here most nodes are dominated by losses. The most notable exceptions are the Metazoa and Opisthokonta LCAs (dominated by gains) and its unicellular ancestors from Holozoa to Choanoflagellata + Metazoa LCAs (in which gains and losses are in a relative stasis). Figure 7—source data 3. (B) Log-ratio of gains-to-losses for single protein domains (brown bars) and protein domain pairs (blue bars), based on the respective ancestral reconstructions. Positive values thus mean that gains are greater than losses. Loss of single protein domains dominates in most nodes, but gains in protein domain combinations can nevertheless outweigh losses in many ancestors (e.g., Holozoa or Metazoa LCAs).