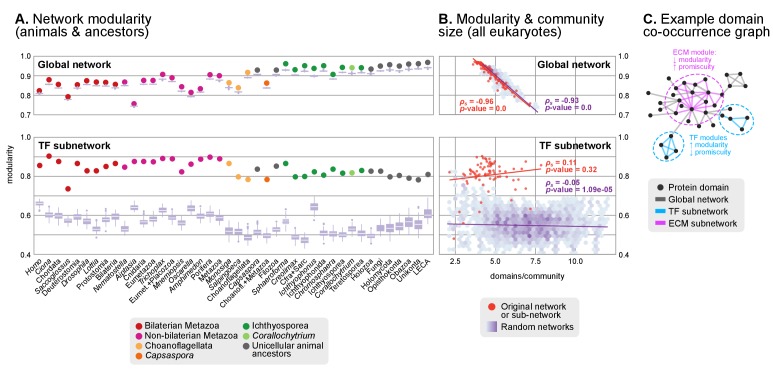
Figure 8. Protein domain architecture networks.
(A and B) Modularity and community size of the global network of domain pairs (upper panels) and the TF subnetwork (lower panels), with ≥90% probability. The modularity parameter measures the fraction of the intra-community edges in the network, minus the expected value in a random network (takes values from 0 to 1; see Materials and methods and [Newman and Girvan, 2004]). Panels at the left show the observed modularity of the protein domain (sub)networks of various genomes (Holozoa and selected ancestors; dots are taxa-colored). Purple box plots represent the distribution of simulated modularities from 100 rewirings of the original organism-specific networks, while keeping a constant vertex degree distribution. Panels to the right show the relationship between modularities and the number of domains/community, both for actual genomes (orange) and simulated rewired networks (purple density plot, see Methods). Monotonic dependence between modularity and domains/community was tested for each set of data (global, TF and their respective simulations) using Spearman's rank correlation coefficient (ρs), and linear regression fits are included for clarity. Note that simulated TF subnetworks are less modular and have more domains/community than the original ones, signaling their higher-than-expected modularities. Note that the scales of the vertical axes change between upper and lower panels. (C) Example of protein domain co-occurrence network. Vertices represent domains, linked by edges if they co-occur within the same gene family. Two subnetworks are highlighted in yellow (domain pairs occurring in TF genes) or green (same for signaling genes). Figure 7—source data 1 and 2, Figure 1—source data 2.


