
Figure 2.
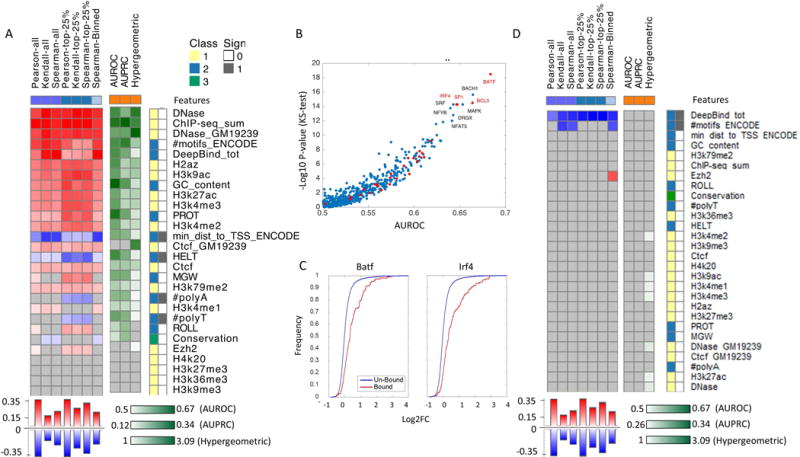
Individual feature accuracy using standard statistical tests. Features classes are divided to four categories (1) experimentally measured epigenetic properties (i.e., DHS, multiple histone modification and TFBS using ChIP-seq). (2) Predicted epigenetic properties (i.e., TFBS predictions: #motifs_ENCODE - number of predicted TFBS based on the presence of DNA binding motifs form ENCODE), or DeepBind_tot - using a Neural network model trained on protein-binding microarrays. min_dist_to_TSS_ENCODE - the distance between the transcription start site of the MPRA construct and the nearest motif hit, #PolyA, #PolyT - length of polyA/T sub-sequence, GC content and DNA shape features: minor groove width (MGW), roll, propeller twist (PROT), and helix twist (HELT)). DeepBind_tot feature was derived by marking the regions that score at the top 90% as hits for every TF, and for every region, count the number of TFs for which it has a hit. The aggregation method we use for these features is log fold between the alternate and reference allele and subtraction for DeepBind_tot. (3) locus-specific properties (i.e., evolutionary conservation scores) (4) k-mer frequencies (not included in this analysis). For regression tasks we applied several correlation measures (Person, Spearman, Kendall), considering either the entire test data (purple squares); variants at the top 25% of quantitative measurements (blue squares); or a binning of the data (light blue squares). For the binary predictions we record the AUROC and AUPRC (orange squares). For both regression and classification tasks we applied a hypergeometric test. The features are ranked based on the median performance across all tests and presented sorted from the most to the least predictive. Non-significant correlations are marked in grey, high positive/high negative/low correlation is marked in red/blue/white for regression and dark green/light green/white respectively for classification. Features categories 1/2/3/4 (only the first 3 presented in this figure) are denoted by yellow/blue/green/pink and the sign of the correlation positive/negative is marked with white/grey. (A) Part I: regression tasks include the expression of the reference and alternate allele, classification task includes regulatory hit prediction. (B) Contribution of individual TFs for predicting regulatory activity of MPRA constructs measured by the minus log p-value of the ks-test for AUROC per factor (C) Cumulative distribution of regulatory activity for regions that are bound/un bound by two of the most predictive factors (BATF and IRF4). (D) Part II: regression tasks includes allelic skew and classification task includes emVar hit prediction.