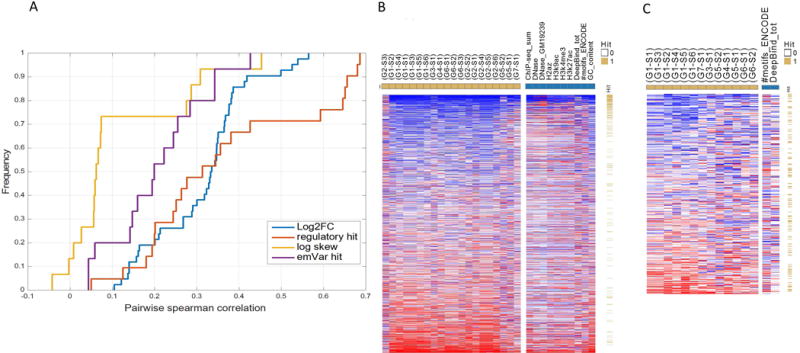
Figure 4.

Regions hardness. Respective accuracy per region and submission is defined as the absolute difference between the observed and predicted rank, scaled by the expected difference (using random ranking). The “region hardness to predict” per part is defined as the mean rank across all tasks. Hard/easy to predict regions are denoted by red/blue respectively and sorted from easy to hard. (A) Cumulative distribution of the Spearman correlation coefficient when comparing each pair of groups (taking the maximum over all possible pairs of submissions) for their regions accuracy per prediction (log2FC, regulatory hit, log skew, emVar hit). (B) Left panel: heat-map of regions hardness for part I when using the predictions from all groups (yellow squares). The regions are sorted by their rank and denoted if they are regulatory hits (yellow/white). Right panel - heat-map of regions hardness when using the top 10 features as predictors (blue squares). (C) Left panel: heat-map of regions hardness for part II when using the predictions from all groups (yellow squares). The regions are sorted by their rank and denoted if they are emVar hits (yellow/white). Right panel - heat-map of regions hardness when using the top 2 features as predictors (blue squares).
