FIGURE 2.
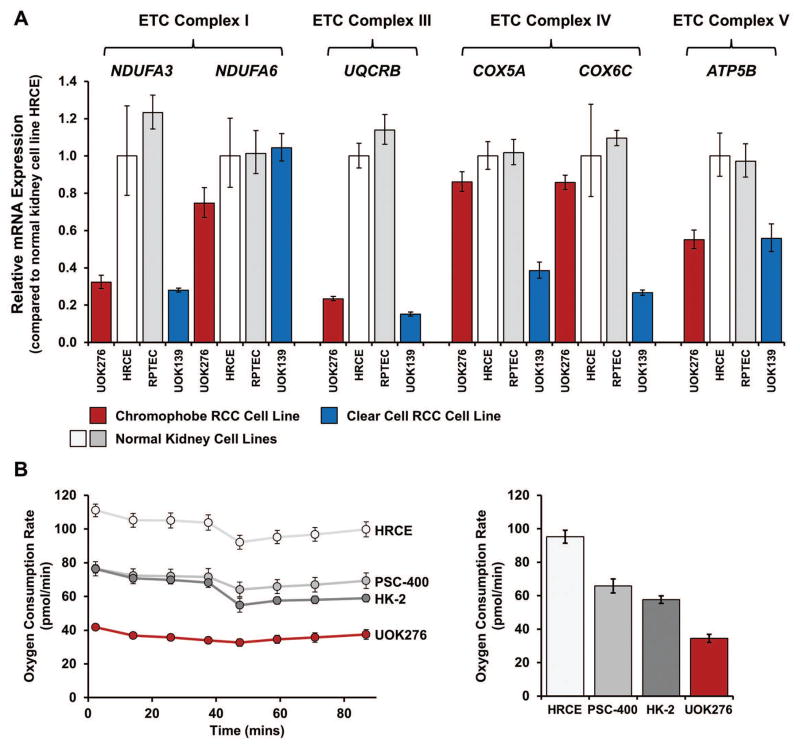
Metabolic analysis of the UOK276 cell line. (A) Most chromophobe RCCs demonstrate increased expression of the genes encoding the components of the electron transport chain (ETC), while clear cell RCCs show decreased expression. TaqMan® mRNA expression analysis for a select number of ETC genes representing ETC complex I (NDUFA3, NDUFA6), ETC complex III (UQCRB), ETC complex IV (COX5A, COX6C), and ETC complex V (ATP5B) was performed to compare the UOK276 cell line with cell lines representing both normal human kidney (HRCE and RPTEC) and clear cell RCC (UOK139). Contrary to expectation, the UOK276 cell line demonstrated lower expression levels of the ETC genes than the normal human kidney cell lines and had an expression pattern that was more similar to the clear cell RCC cell line. (B) The oxygen consumption rate (OCR) for UOK276 was evaluated using a Seahorse XF96 Extracellular Flux Analyzer and compared with three normal kidney control cell lines (HK-2, PSC-400 and HRCE). The OCR was measured for 90 min and a comparison graph at the 60-min time point demonstrates a lower rate of oxygen consumption in the UOK276 cells that is consistent with the decreased expression of the ETC complex genes.

