FIGURE 5.
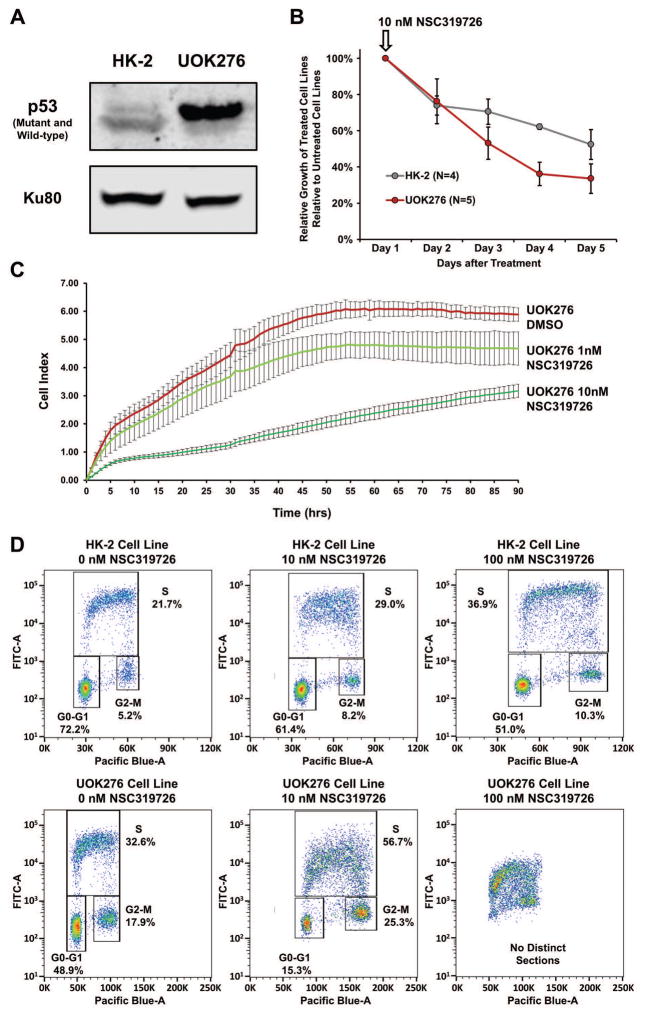
TP53 Mutation Targeted Therapy. (A) Western blot analysis demonstrated that the mutant TP53 protein was expressed within the UOK276 cells, but not the HK-2 cells that were immortalized using a recombinant retrovirus containing the human papilloma virus (HPV 16) E6/E7 genes that promote TP53 protein degradation. (B) The effect of a single dose of the mutant TP53 reactivating drug 10 nM NSC319726 on cellular growth was evaluated for both the UOK276 and HK-2 cells and the relative number of cells between the treated and untreated cells was measured each day for 5 days using MTT assay. NSC319726 had a greater effect on the UOK276 cells than the HK-2 cells. This was repeated 3 times with 3 replicates in each experiment and the error bars represent standard deviation. (C) Real-time cell invasion assay analysis demonstrated a dose dependent suppression of invasion of UOK276 cells in response to a single starting dose of either 1 nM or 10 nM NSC319726 over a 90 h time period. Each time point represents the average of 4 replicates and the error bars represent standard deviation. (D) Bivariate cell cycle analysis, using BrdU to measure DNA synthesis and FxCycle Violet to measure DNA content, demonstrated that the increasing levels of NSC319726 had a greater effect on the cell cycle in the UOK276 cells in comparison to the HK-2 cells. The lower 10 nM dose produced a rapid decline in the percentage of UOK276 cells in G0/G1 and the higher 100 nM dose resulted in a complete loss of definable cell cycle phases.

