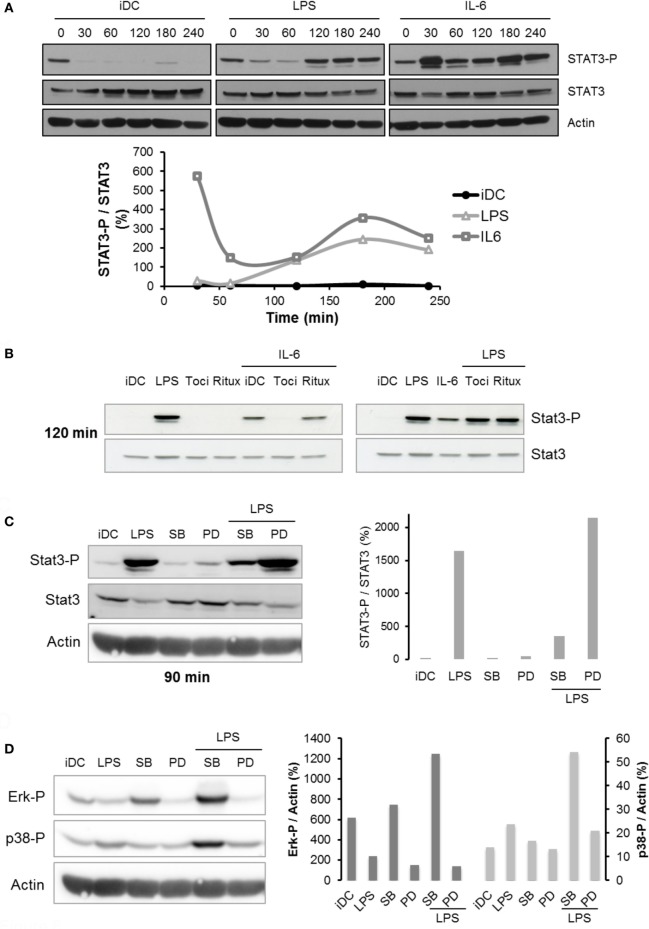
Figure 6.
Regulation of STAT3 pathway following lipopolysaccharide (LPS) treatment. (A) iDCs were treated with LPS 50 ng/ml or IL-6 150 ng/ml. STAT3 and STAT3-Tyr705 phosphorylation levels were assessed by Western blot up to 240 min. The blot presented is representative of two independent experiments. Quantification of the bands was plotted as phosphorylated STAT3/non-phosphorylated STAT3 ratio. (B) iDCs were pretreated with tocilizumab or ritux 50 µg/ml during 30 min and then treated with LPS 50 ng/ml or IL-6 150 ng/ml. STAT3 and STAT3-Tyr705 phosphorylation levels were assessed by Western blot at 120 min. The blot presented is representative of two independent experiments. (C,D) iDCs were pretreated with SB203580 (SB) or PD98059 (PD) 25 µM prior to LPS maturation (50 ng/ml). STAT3 and STAT3-Tyr705 phosphorylation levels (C) and Erk1/2-Thr202/Tyr204 and p38-Thr180/Tyr182 phosphorylation levels (D) were assessed by Western blot. The quantification was done on the correct respective actin blots as explained in Section “Materials and Methods.” The blot presented is representative of two independent experiments. Quantification of the bands was plotted as phosphorylated STAT3/total STAT3 (C) or phosphorylated Erk1/2 or p38/actin (D) ratio.

