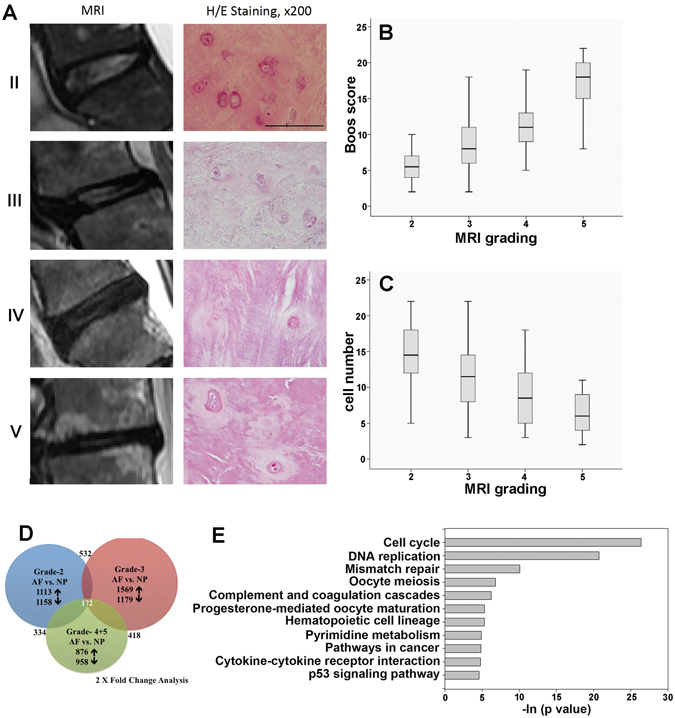
Figure 1.

Histology of intervertebral disc in discectomy patients. (A) Typical MRI images of patients with Pfirrmann grades 2 to 5. NP cell density and extracellular matrix decreased with the IVD degenerative process, and round cartilage-like cells are replaced by fibroblasts (right column H/E, 200×). Scale = 100 μm. (B) Comparison of the Boos score with the MRI grade, p < 0.001 by one-way ANOVA method. (C) Comparison of cell number with MRI grade, cell number was counted in one field at 200 × magnification under a microscope, p < 0.001 calculated by one-way ANOVA. (D) Proportional Venn diagram illustrating the genes significantly altered by AF and NP at different grades. The number of genes (fold change threshold > 2) unique to each comparison that were increased or decreased are listed next to arrows indicating the direction of change. The Venn diagram reveals a core of 172 genes that were changed in AF compared with NP across all grades. The large number of unique gene expression changes in each condition illustrates that the gene expression is altered by the clinical stage of the patient (blue = grade 2, red = grade 3, green = grade 4 & 5). (E) Functional analysis of the differentially regulated genes was carried out using Kyoto Encyclopedia of Genes and Genomes (KEGG) database (http://www.kegg.jp/ or http://www.genome.jp/kegg/). The functional annotation clusters are shown as Pathways that had a p value < 0.01.
