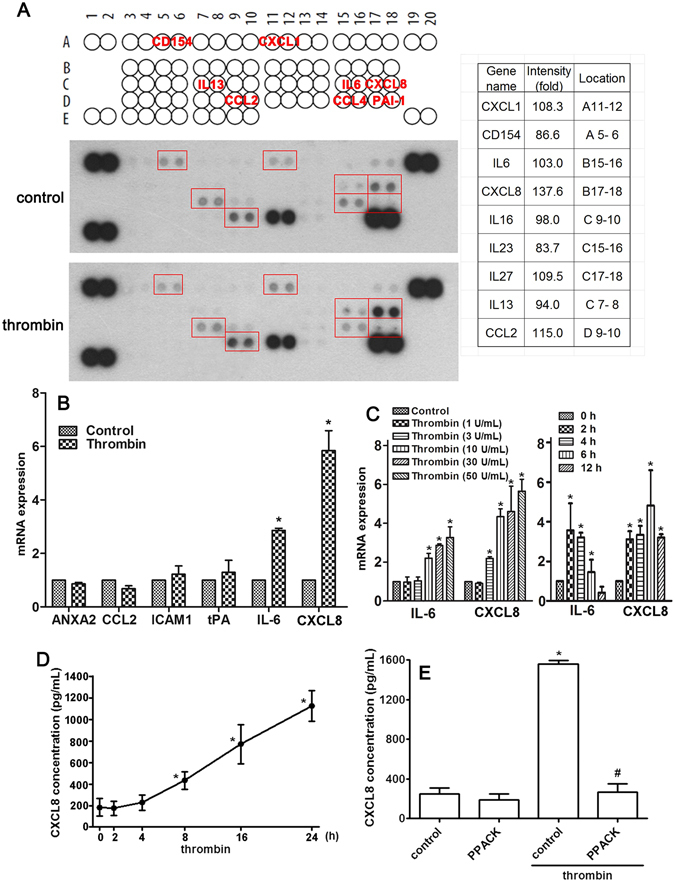
Figure 2.

Regulatory effects of thrombin on cytokine and chemokine expressions in NP cells. (A) After treatment with thrombin, or an equal volume of vehicle, for 24 h, the supernatants from NP cell cultures were collected and applied to each of two separate cytokine/chemokine array membranes. The locations of cytokines and chemokines detected on the membrane are shown in the upper panel, and the quantitative data is shown in the right-hand panel. (B) Administration with thrombin (10 U/mL) to NP cells for 6 h, and the effect on mRNA of the indicated genes was determined using real time-PCR. (C) NP cells were treated with various concentrations of thrombin for 6 h, or 10 U/mL thrombin for the indicated time periods (2, 4, 8, 16 or 24 h). (D) Supernatants were collected for ELISA measurement of CXCL8. Each time point represents the mean ± S.E.M. from at least three independent experiments performed in duplicate. (E) NP cells were incubated with PPACK (1 μM) for 30 min followed by treatment with thrombin (10 U/mL) for 24 h, and CXCL8 protein levels were determined by ELISA. Each bar represents the mean ± S.E.M. from four independent experiments performed in duplicate. *p < 0.05 compared with the vehicle control group. # p < 0.05 compared with the thrombin-treated group.
