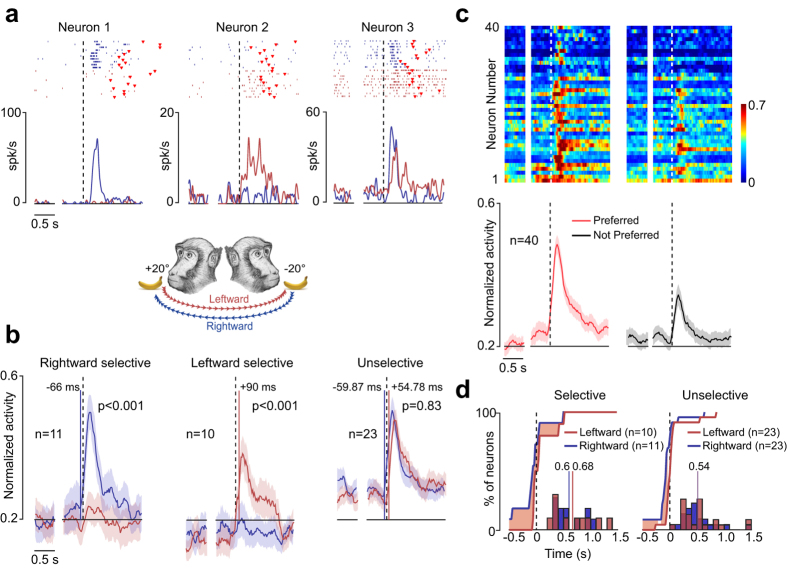
Figure 3.
Functional properties of BA 9/46dr head-rotation neurons. (a) Examples of three head-rotation neurons. For each neuron, rasters and spike-density function on the left exemplify the baseline activity. After the gap, the activity is aligned (dashed lines) to the head movement onset, and the period immediately before the dashed line represents the neural activity during the premovement epoch. Red markers represent the movement offset. (b) Population activity of three different types of head-rotation neurons (Rightward selective, Leftward selective and Unselective). Population activity is aligned as single-neuron examples. The colored shaded area around each curve represents 1 standard error. The colored lines superimposed on the population activity represent the time of population-activity onset. Rightward selective (F = 15.72, p < 0.001) and Leftward selective (F = 12.11, p < 0.001) neurons exhibited directional selectivity during the head-rotation phase, whereas Unselective neurons did not exhibit any directional tuning (F = 0.19, p = 0.83). (c) Population plot of excitatory head-rotation neurons aligned (dashed lines) as in (b) and grouped based on their directional preference. In the top part, each row represents a single neuron, whereas the bottom part shows the averaged population plot. Alignments and conventions are the same as in panel (a). (d) Curves represent cumulative distribution of neurons’ latencies relative to the movement onset of selective and unselective head-rotation neurons during rightward (blue) and leftward (red) head rotation. The red shaded areas represent the time interval in which the proportion of neurons during rightward (blue) and the proportion during leftward (red) head rotation were significantly different from each other (χ2 test performed bin per bin, bin = 100 ms, p < 0.05). Histograms describe the distribution of burst duration for selective (left plot) and unselective (right plot) head-rotation neurons during rightward (red) and leftward (blue) head rotation. The colored lines superimposed on the histograms represent the averaged burst duration.

