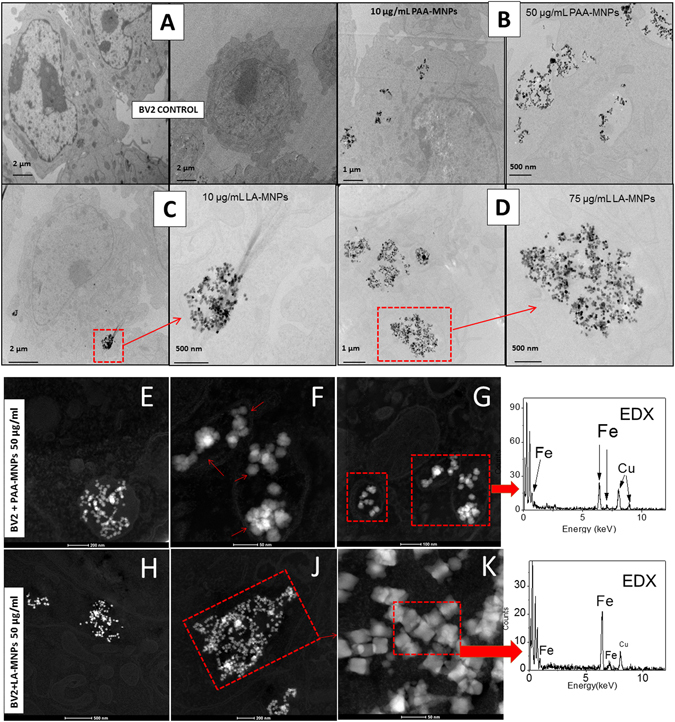
Figure 4.

TEM images of BV2 cells with MNPs: (A) Control cells (B) BV2 incubated with PAA-MNPs 10 and 50 µg/ml; (C) BV2 incubated with LA-MNPs at 10 µg/ml and magnified image of the clusters; (D) BV2 incubated with LA-MNPs at 75 µg/ml and magnified image of clusters. (E–G) STEM images of BV2 cells incubated with 50 μg/ml of PAA-MNPs; H-K) STEM images of BV2 cells incubated with 50 μg/ml of LA-MNPs. The last column shows the Energy-dispersive X-ray spectroscopy EDS-HAADF spectra of PAA-MNPs (upper) and LA-MNPs (lower) inside the cell.
