
Figure 1.
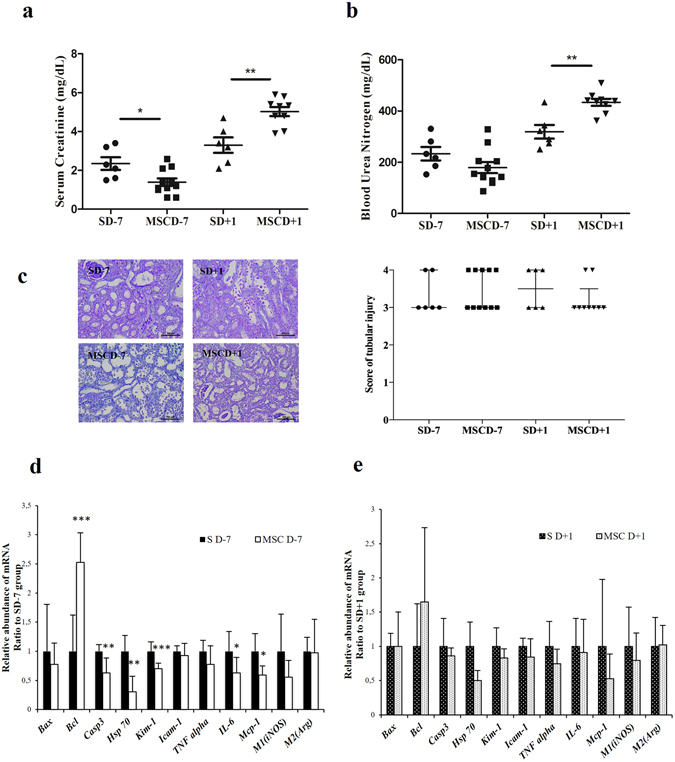
Kidney functional and structural parameters and markers of apoptosis and cell proliferation in renal parenchyma after ischemia/reperfusion according to the timing administration of MSC. (a–d) Lewis rats underwent i.v. injection of MSC 7 days before (MSCD − 7, n = 11) or 1 day after (MSCD + 1, n = 9) renal I/R. Control group received equal volume of saline at the same time-points (SD − 7, n = 6; SD + 1, n = 6) (a,b) Serum creatinine (SCr) and blood urea nitrogen (BUN) levels were measured at 48 h post renal I/R. (c) Histologic damage was graded on PAS-stained kidney sections following Jablonski score63. Results are shown as medians and interquartile range. (d,e) Real-time qPCR quantification of mRNA expression levels of Bax, Bcl-2, Caspase-3 (Casp3), Heat-Shock Protein 70 (Hsp70), Kidney Injury Molecule 1 (Kim-1), Intercellular Adhesion Molecule 1 (Icam-1), Tumor Necrosis Factor alpha (Tnfα), Interleukine 6 (IL-6), Monocyte Chemotactic Protein 1 (Mcp-1), inducible NO synthase (iNOS) and arginase (Arg) in the kidney after 45 minutes of ischemia followed by 48 hours of reperfusion in SD − 7 versus MSCD − 7 groups (d) and in SD + 1 versus MSCD + 1 groups (e). The mRNA expression levels were standardized using Gapdh as housekeeping gene. Significant differences are indicated, *p ≤ 0.05, **p ≤ 0.01 and ***p ≤ 0.001.