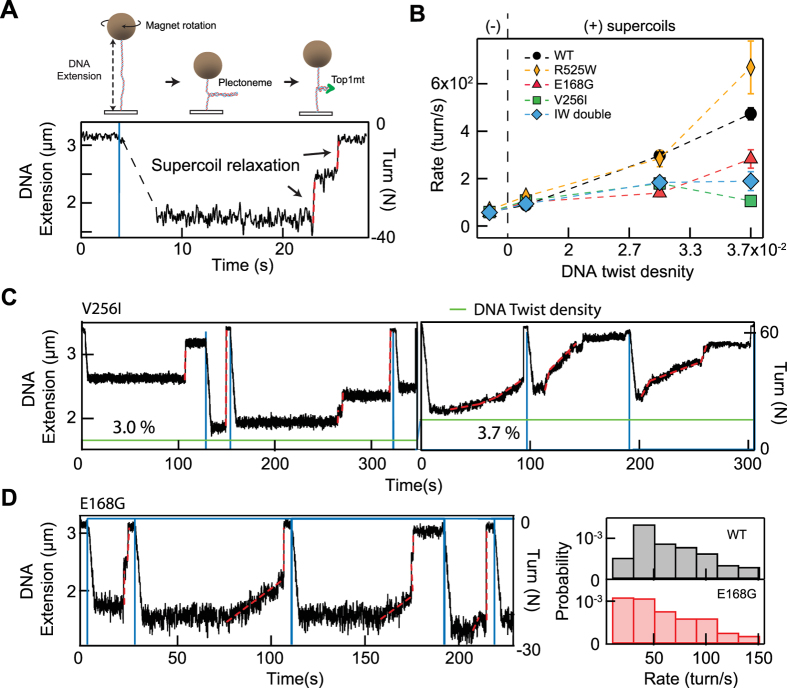
Figure 4.
Single-molecule assay to characterize DNA supercoil relaxation activity of WT TOP1MT and three TOP1MT variants. (A) Schematic of single-molecule DNA supercoil generation and measurement of TOP1 relaxation using magnetic tweezers (not to scale). The DNA extension decreases as supercoils are introduced in the DNA molecule by rotating DNA tethered magnetic bead with the external magnets (see methods). The DNA extension increases as TOP1 relaxes the supercoiled DNA molecule. Individual TOP1 supercoil relaxation events (highlighted with dashed red lines) are analyzed to extract the rate of supercoil relaxation and the number of supercoils relaxed per cleavage-religation cycle. (B) The supercoil relaxation rate for WT and three TOP1MT variants as a function of the imposed twist on the DNA, proportional to the torque applied on the DNA. (C) Single-molecule relaxation measurements illustrating decreased relaxation activity of V256I TOP1MT variant under high positive DNA twist density (3.7%). The DNA extension is plotted as a function of time (black line, left axis), the introduction of supercoils is indicated by the blue lines (right axis), the twist density is reported as a percentage and indicated by the green line. Note the variation in relaxation rate during individual relaxation events (e.g., at ~100 s on the right panel) and the increased prevalence of slow relaxation events at higher (3.7%) twist density (right panel) compared to the lower (3.0%) twist density (left panel) (D) Example of random switching between slow and WT relaxation rates for E168G TOP1MT (left panel). The distributions of relaxation rates indicate a higher probability of slow relaxation rate events (<20 turn/s; marked as shade) for the E168G variant compared to WT Top1mt (right panel).

