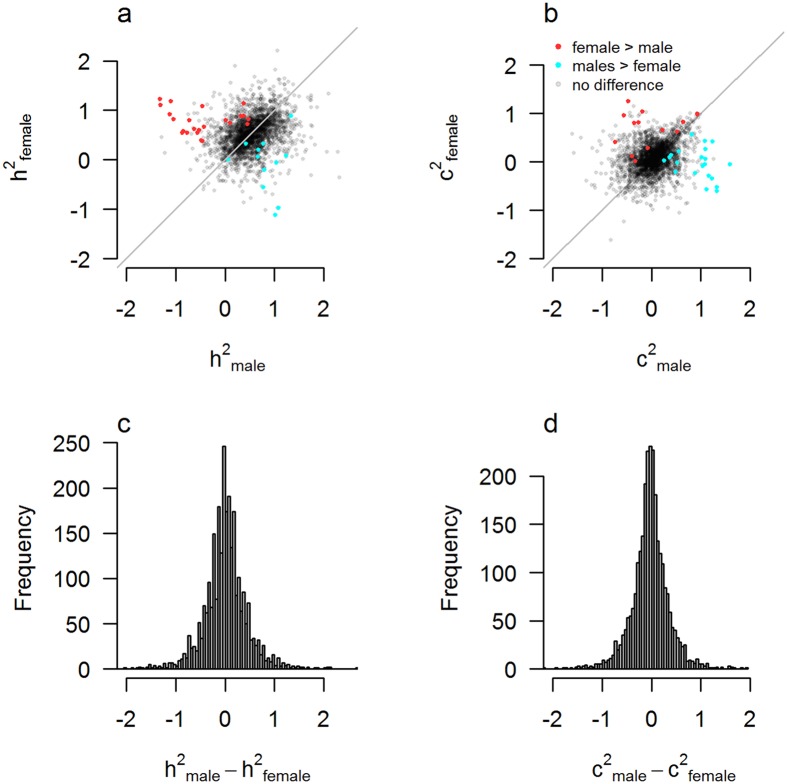
Figure 1.
Estimates of genetic and environmental influences for males versus females across individual study traits. Scatterplots of estimates of (a) heritability (h2 = 2(rMZ − rDZ)) and (b) amount of shared environment (c2 = 2rDZ − rMZ) for males versus females. Red dots indicate traits for which the female estimate is significantly larger than the male estimate after. Blue dots indicate traits for which male heritability is significantly larger than female heritability. Grey dots indicate no statistically significant difference after Bonferroni correction for 2,608 trait statistics. The bottom graphs show the distribution of male-female differences in genetic effects (c) and shared environmental effects (d).

