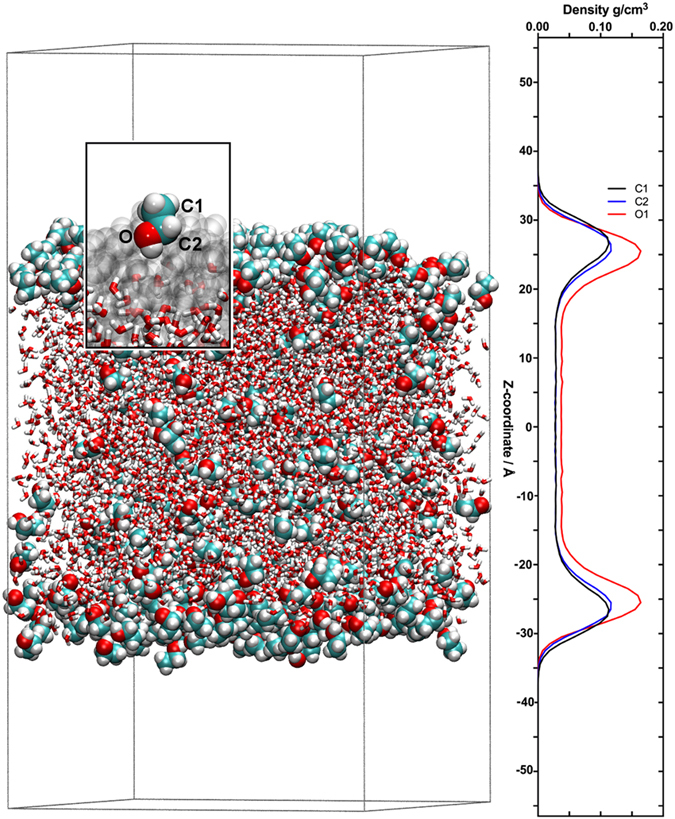
Figure 2.

Preferred distribution of EtOH molecules. Snapshot of an all-atom MD simulation of a 27 vol-% EtOH mixture with a single guaiacol molecule. EtOH molecules are shown in van der Waals representations, and the water molecules are shown in licorice representations. The carbon atoms are displayed in turquoise, hydrogen atoms in white and oxygen atoms in red. The z-axis atomic mass density distribution of the carbon (C1 and C2) and oxygen (O) atoms of EtOH is also shown. The outwards-orientation of the ethyl groups suggests that EtOH molecules localised at the liquid-air interface behave like a surfactant. In the insert, a single molecule of EtOH is shown in van der Waals representation, the remaining EtOH molecules are displayed in grey transparent surface representations and water molecules in licorice representations.
