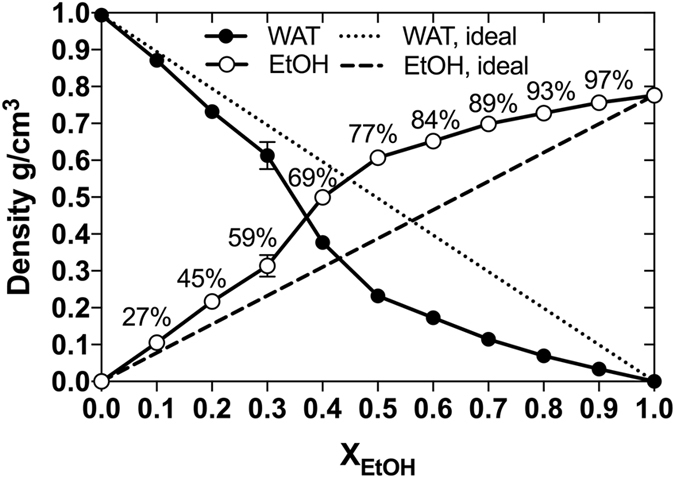
Figure 4.

Bulk density of solvents. The calculated (circles) bulk densities (at z = 0) of water (WAT, filled circles) and EtOH (empty circles) are shown as functions of EtOH concentration. The dots were connected with lines as guides for the eye. The non-ideal mixing behaviour is evident by comparison with the theoretical densities (dashed lines) of water and EtOH in an ideal mixture. Values are here presented as the mean ± standard deviation from five separate 30 ns blocks of data covering the total simulation time of 50 ns (0–30 ns, 5–35 ns, 10–40 ns, 15–45 ns, and 20–50 ns).
