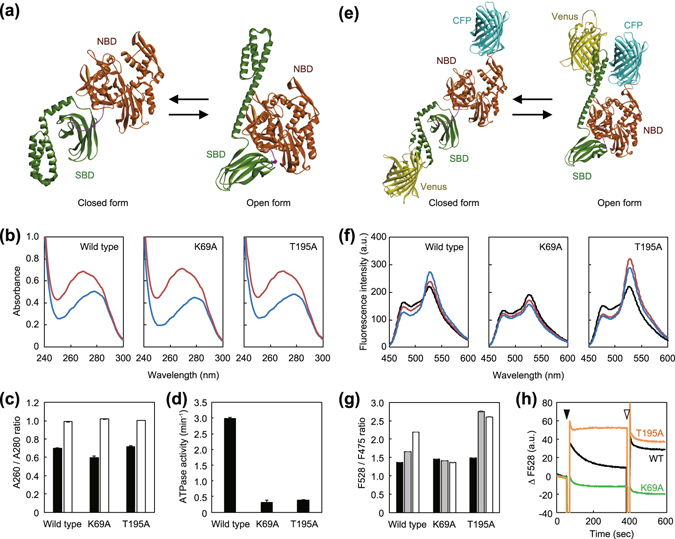
Figure 1.

Characterization of K69A and T195A mutants of TDnaK. (a) Structural models of TDnaK constructed by homology modeling using DiscoveryStudio 4.5 software. EDnaK in the closed (PDBid:2KHO)16 and open (PDBid:4B9Q)12 forms were used as templates. The NBD and the SBD are colored by brown and green, respectively. (b) TDnaK and its mutants were subjected to HPLC size exclusion chromatography (SEC) in the presence of 10 mM EDTA to remove bound nucleotides and their UV spectra were measured (blue line). The nucleotide-depleted TDnaKs were incubated with 3 mM ATP and subjected to SEC to remove unbound nucleotides. The spectra of the eluted proteins were also measured (red line). (c) The A260/A280 ratio of the nucleotide-depleted (filled bar) and ATP-treated (open bar) TDnaKs are shown. (d) ATPase activities of TDnaK and its mutants (2.5 μM) measured in the presence of 5.0 μM TDnaJ, 5.0 μM TGrpE, and 3 mM ATP are shown. (e) Structural models of TK-FRET. The CFP and the Venus portions are colored by cyan and yellow, respectively. (f) TK-FRET and its mutants were treated as in b) and the fluorescence spectra of the nucleotide-depleted proteins in the absence (black line) and the presence of 2 mM ATP (red line), or the presence of 2 mM ATP and 1.0 μM TGrpE (blue line) were measured. (g) The F528/F475 ratio of the nucleotide-depleted TK-FRETs in the absence (filled bar) and the presence of 2 mM ATP (gray bar), or the presence of 2 mM ATP and 1.0 μM TGrpE (open bar) are shown. (h) Changes of F528 of the nucleotide-depleted TK-FRETs; wild-type (black), K69A (green), and T195A (orange) mutants are shown. The black and white arrows indicated the time points at which the ATP and TGrpE were added, respectively. (f)–(h) Excitation wavelength was 435 nm. (c,d and g) Error bars represent standard deviations of three or more independent measurements.
