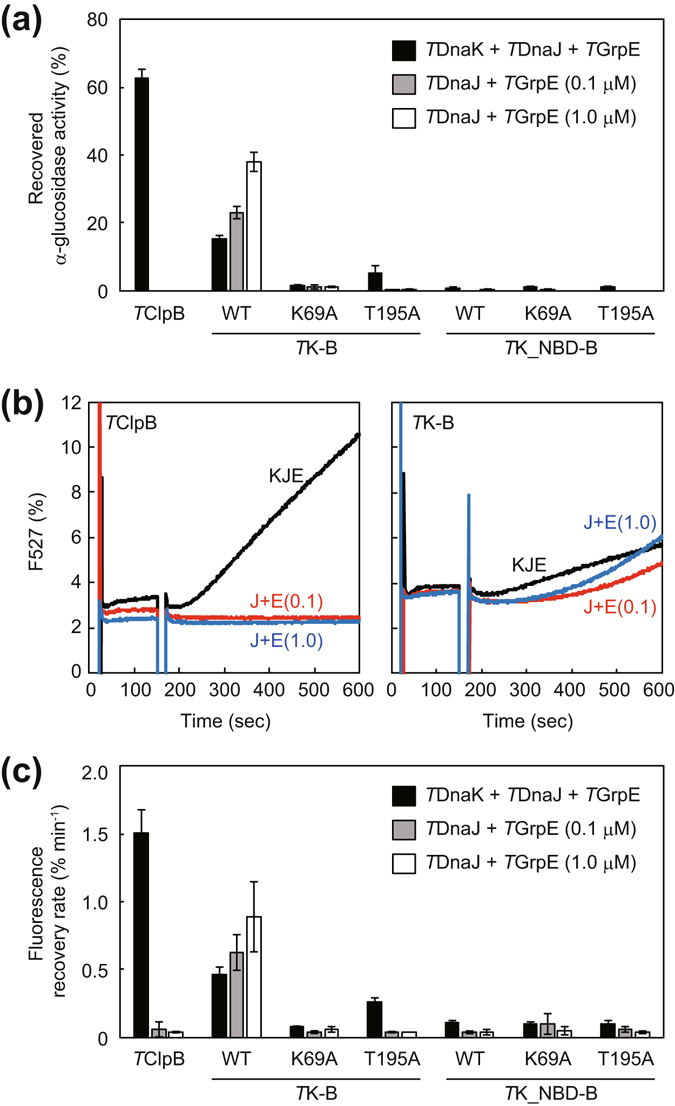
Figure 3.

Disaggregation activities of fusion proteins. (a) Heat-aggregated α-glucosidase (0.2 μM) from moderate therrmophilic bacteria was incubated with TDnaK (0.6 μM), TDnaJ (0.2 μM), and TGrpE (0.1 μM dimer) (termed TKJE), and the indicated TClpB or fusion proteins (0.05 μM hexamer) at 55 °C for 90 min in the presence of 5 mM ATP (black bar). After the incubation, the recovered enzymatic activity was measured and is shown as a percentage of the activity prior to heat aggregation. TDnaJ (0.2 μM) with TGrpE (0.1 μM dimer) (termed TJE0.1) (gray bar) or TDnaJ (0.2 μM) with TGrpE (1.0 μM dimer) (termed TJE1.0) (open bar) were also used instead of TKJE. (b) Heat-aggregated EYFP (0.3 μM) was incubated with chaperones at 55 °C in the presence of 5 mM ATP, and the fluorescence at 527 nm (excitation 513 nm) was monitored. TClpB (left panel) and TK-B (right panel) were used. TKJE (black line), TJE0.1 (red line), or TJE1.0 (blue line) was also added. Fluorescence intensities are shown as a percentage of that prior to heat aggregation. (c) Initial rates (except for the lag times if existing) for the fluorescence recovery of EYFP were calculated from the measurement of (b) and the same experiments using TK-B, TK_NBD-B, and their mutants. Error bars represent standard deviations of three or more independent measurements. WT, wild-type.
