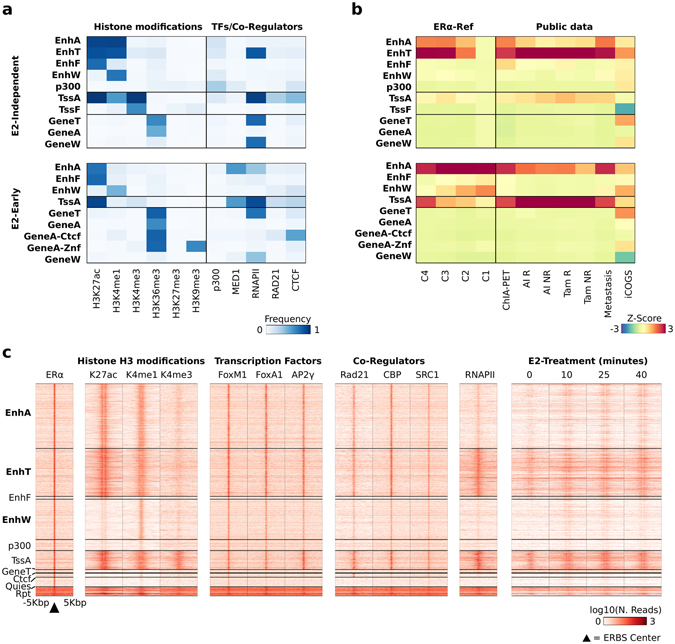
Figure 3.

Epigenetic-based classification of the ERα-Ref. (a) Heat maps reporting the frequency of significant ChIP signal of epigenetic modifications, TFs, and co-regulators overlapping the MCF-7 chromatin states predicted for the E2-Independent (top) and E2-Early (bottom) experimental contexts. (b) Heat map reporting the enrichment of the overlap between chromatin states and genomic annotations for the two experimental contexts considered. These annotations include: coordinates of regions involved in long-range chromatin interactions (ChIA-PET), ERBSs identified in tumors from breast cancer patients before receiving Aromatase Inhibitor (AI) or Tamoxifen (Tam) and that responded (R) or not (NR) to treatment, and list of variants from iCOGS project. (c) Intensity heat map reporting the normalized signal of different ChIP-Seq experiments measured in a window of ±5 kbp centered on each E2-Independent ERBS. The signal of ERα and H3K27ac, H3K4me1 and H3K4me3 histone modifications is reported on the left. The signal of the three ERα-correlated TFs and co-regulators is reported in the center. The signal of a RNAPII ChIP-Seq and a GRO-Seq experiment of E2-treated MCF-7 is reported on the right.
