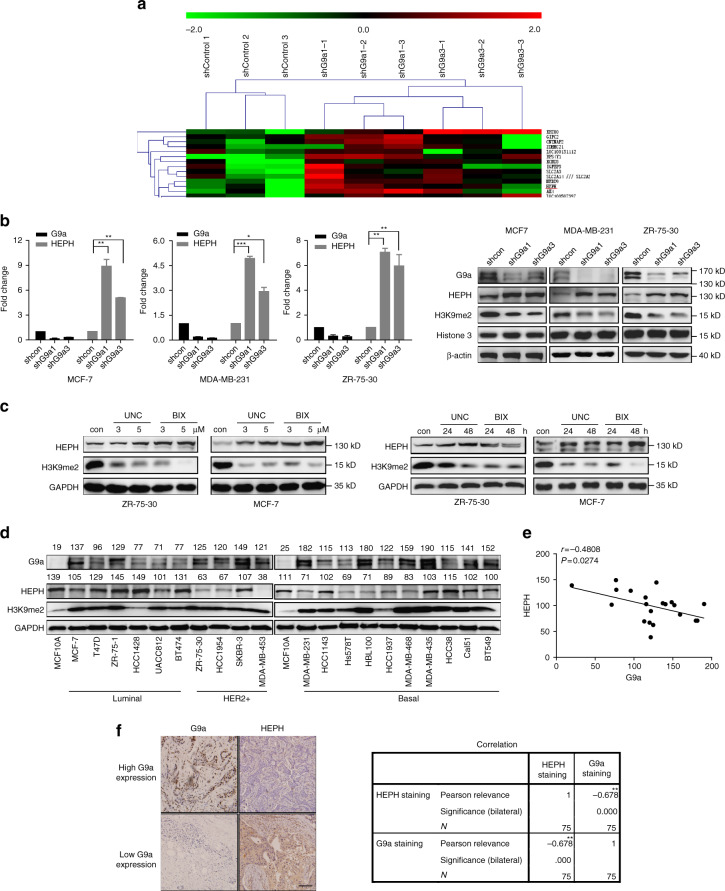
Fig. 2.
G9a negatively regulates HEPH expression. a Microarray profiling of gene expression in MDA-MB-231 G9a knockdown cell lines. Heat map values represent the log2 fold change of read counts relative to the counts in the shcontrol cells (lane 1–3).Validation of the microarray analysis results by reverse-transcription–PCR and western blotting. Relative HEPH mRNA and protein levels in G9a knockdown b and G9a inhibitor-treated c cell lines were evaluated. The levels of HEPH and G9a expression in human normal mammary epithelial cell MCF10A and twenty breast cancer cell lines were quantified by Image J d and the correlation between them was analyzed using GraphPad; GAPDH was used as a loading control e. Data represent the mean of three independent experiments. f Immunohistochemical staining analysis of G9a and HEPH proteins in serial sections from breast cancer patients. Pearson’s relevance was used to compare G9a and HEPH immunostaining. Note inverse correlation of G9a and HEPH protein expression in tumor cells. Shown are representative sections. Scale bar, 50 μm. Results are representative of at least three independent experiments compared with the value for the untreated control and are shown as means with SD. Two-tailed unpaired Student’s T-test was performed. *P < 0.05, **P < 0.01 and ***P < 0.001

