Fig. 2.

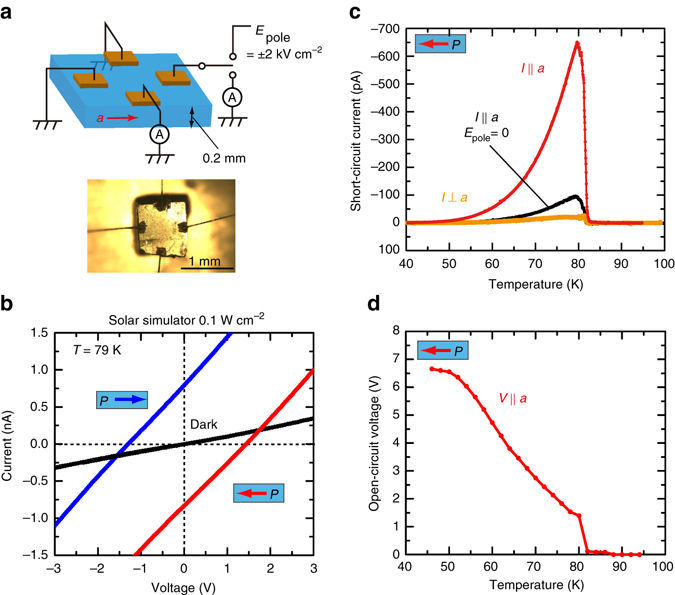
Photovoltaic properties of TTF-CA. a The upper panel presents a schematic of the sample configuration for the photovoltaic effect measurements. The lower panel presents an optical microscope image of an actual sample. b I–V characteristics at 79 K with and without photoirradiation. The light source was a solar simulator (0.1 W cm−2). Before the I–V measurements, the polarization was aligned by cooling the sample from 100 to 30 K under E pole = 2 kV cm−1. The signs of the photocurrent and photovoltage are reversed by inverting E pole. c Temperature dependence of zero-bias photocurrent measured under photoirradiation. The measurements were performed along the directions parallel and perpendicular to the a-axis after the same poling procedure. We also measured the photocurrent without the poling procedure (E pole = 0). d Temperature dependence of the open-circuit photovoltage along the a-axis
