
Figure 4.
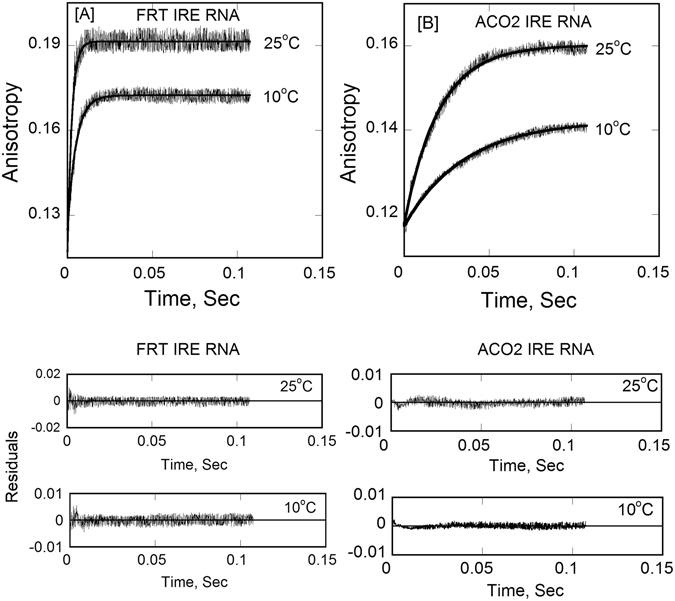
Stopped-flow kinetic measurements of binding of FIFRT IRE-RNA and FIACO2 IRE-RNA with IRP1 protein. Representative kinetic data show the time-dependent increase in anisotropy after (A) FRT IRE-RNA and (B) ACO2 IRE-RNA had been mixed with IRP1 at temperature 25 °C and 10 °C. FRT and ACO2 IRE-RNA concentrations was 50 nM (final) and the IRP1 concentration was 1 µM (final). The solid line represents the fitted curve drawn through the data points was fit by assuming a single-exponential process. Residuals for the exponential fits are shown in the bottom panels. The experimental conditions are described in Experimental Procedures.