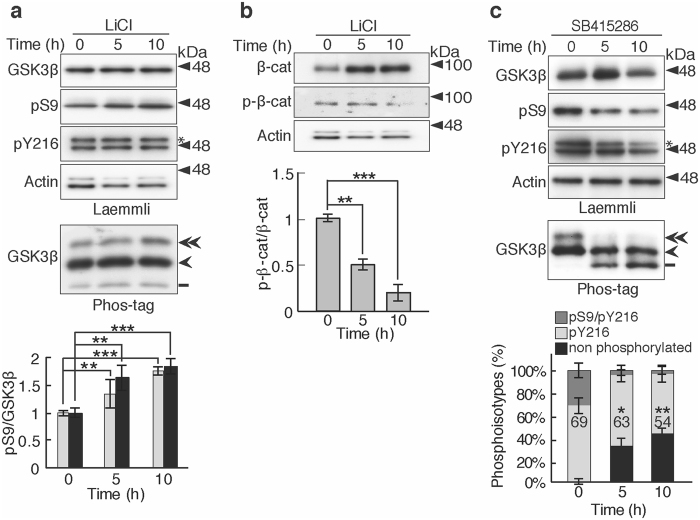
Figure 3.
Effects of LiCl and SB415286 on the phosphorylation states of GSK3β. (a) Effects of LiCl on the phosphorylation states of GSK3β. CHO-K1 cells were treated with 10 mM LiCl for 5 or 10 h and the resulting cell extracts were subjected to Laemmli’s and Phos-tag SDS-PAGE, followed by immunoblotting with the indicated antibodies. An asterisk in the pY216 blot indicates GSK3α. In Phos-tag (bottom), the double-arrowhead represents Ser9/Tyr216-phosphorylated GSK3β, the arrowhead represents Tyr216-phosphorylated GSK3β, and the bar represents nonphosphorylated GSK3β. Quantification of phospho-Ser9 was shown in the lower graph; gray represents the data from Laemmli and black represents the data from Phos-tag SDS-PAGE (means ± s.e.m. n = 6, **p < 0.01, ***p < 0.001, one-way ANOVA). (b) Phosphorylation of β-Catenin in CHO-K1 cells treated with LiCl as in (a). The CHO-K1 cell extracts were immunoblotted with anti-β-Catenin or anti- phospho-β-Catenin. Actin was the loading control, the same as shown in (a). The ratio of phospho-β-Catenin to total β-Catenin was quantified and expressed against that of the control at 0 h (means ± s.e.m. n = 6, ***p < 0.001, one-way ANOVA). (c) Effects of SB415286 on the phosphorylation states of GSK3β. CHO-K1 cell extracts treated with 20 μM SB415286 for 5 or 10 h were subjected to Laemmli’s (upper four panels) and Phos-tag (bottom) SDS-PAGE, followed by immunoblotting with the indicated antibodies. An asterisk in the pY216 blot indicates GSK3α. In Phos-tag, the phosphoisotypes are indicated as in (a) and are quantified: the upper dark gray section represents phospho-Ser9/phospho-Tyr216, the middle light gray section represents phospho-Tyr216, and the lower black section represents nonphosphorylated GSK3β. The percentages of phospho-Tyr216 are indicated (means ± s.e.m. n = 6, *p < 0.05, **p < 0.01, one-way ANOVA). Uncropped immunoblots after Laemmli’s and Phos-tag SDS-PAGE are provided in Supplementary Fig. 7.

