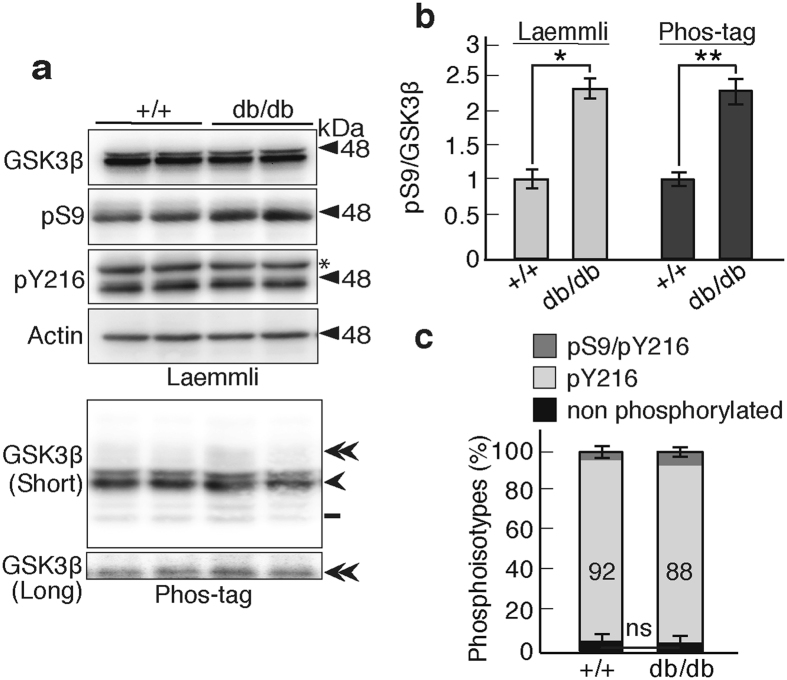
Figure 8.
GSK3β phosphoisotypes in the brains of db/db mice. (a) GSK3β, phospho-Ser9 (pS9), phospho-Tyr216 (pY216) and actin in the cerebral cortex of wild type mice (+/+, left two lanes) or db/db (right two lanes) were examined using the Laemmli’s SDS-PAGE and phosphorylation of GSK3β by Phos-tag method. (b) The ratio of phospho-Ser9 to total GSK3β in wild type (+/+) and db/db mice. The left two bars show the data obtained from the anti-phospho-Ser9 immunoblot after Laemmli’s SDS-PAGE and the right two bars show the data obtained with Phos-tag SDS-PAGE. The ratio is expressed relative to that in the wild type (+/+) mouse brain (means ± s.e.m. n = 4, *p < 0.05, **p < 0.01, Student’s t test). (c) The percentages of the GSK3β phosphoisotypes on Phos-tag SDS PAGE were quantified: dark gray, phospho-Ser9/Tyr216; light gray, phospho-Tyr216; and black, nonphosphorylated GSK3β. The percentages of phospho-Tyr216 are indicated (means ± s.e.m. n = 4, ns, not significant). Uncropped immunoblots of GSK3β, pS9, pY216 and actin after Laemmli’s SDS-PAGE and GSK3β after Phos-tag SDS-PAGE are provided in Supplementary Fig. 11.

