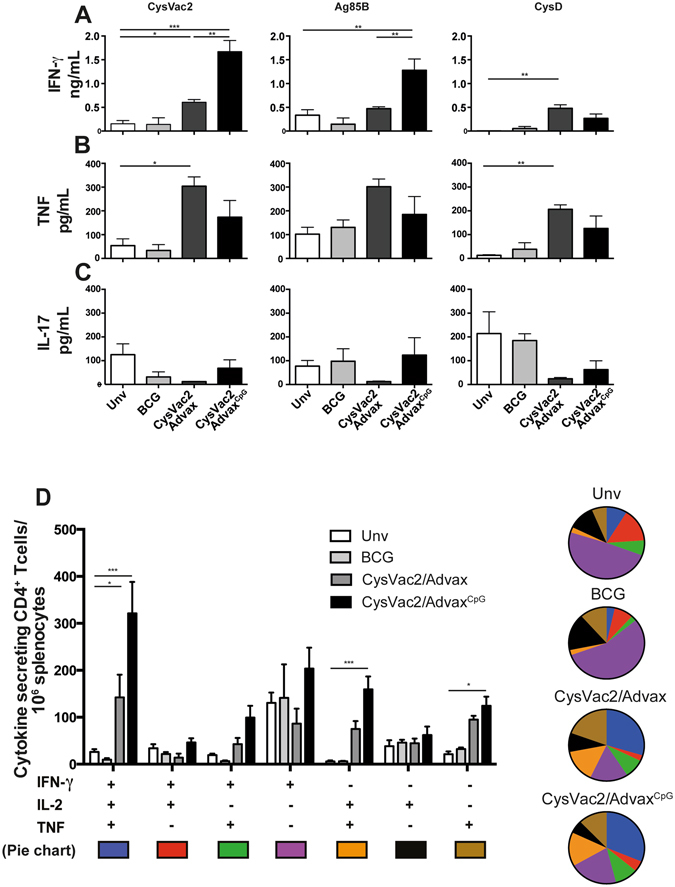
Figure 3.

Vaccine-specific CD4+ T cell response post-M. tuberculosis challenge. C57BL/6 mice (n = 5) were vaccinated as in Fig. 2 and 12 weeks after the first vaccination mice were challenged with approximately 100 CFU of M. tuberculosis. Four weeks after infection splenocytes were re-stimulated with CysVac2 or its singular components (Ag85B and CysD) and the levels of IFN-γ (A), TNF (C) or IL-17 (C) production in the supernatants were measured by ELISA. Splenocytes were re-stimulated in vitro with CysVac2 in the presence of brefeldin A and the frequency of CysVac2-specific cytokine secreting CD4+ T cells determined by flow cytometry (D). Data (average ± SEM) is representative of two independent experiments. Statistical significance between the groups was determined by ANOVA (*P < 0.05, **p < 0.01; **p < 0.001).
