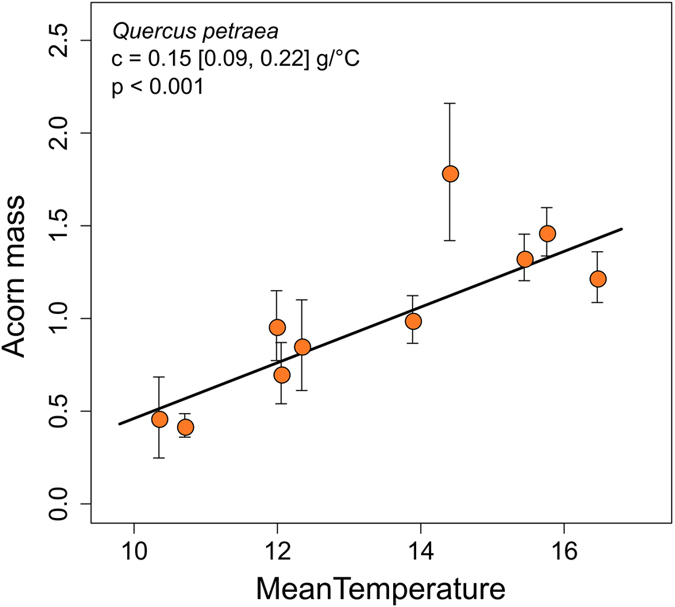
Figure 3.

Temperature trends in seed mass for Quercus petraea. Trend in acorn mass (g) with mean temperature from April to November (°C) along the elevation gradient. Each dot corresponds to the mean acorn mass, across years and trees, per population along the elevation gradients. The slope of the regression line and its 95% confidence interval, calculated from a linear mixed-effects model, and the coefficient of determination (R 2) are indicated. April to November corresponds to reproductive cycle length in Q. petraea: from flowering to acorn release.
