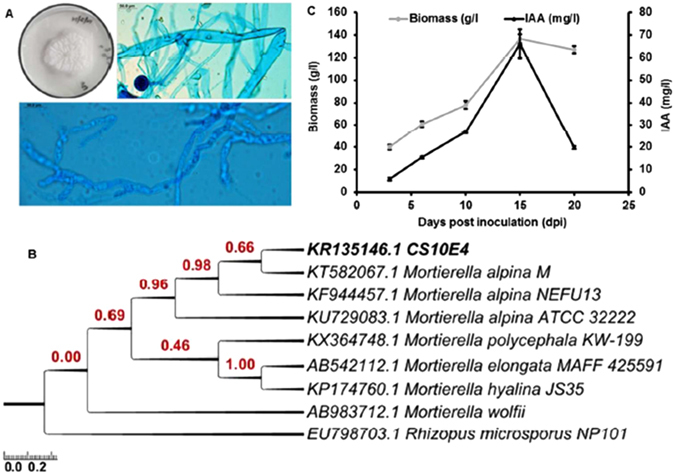
Figure 1.

Morphology, molecular phylogeny and plant growth promoting property of the endophyte CS10E4 isolated from Crocus sativus. (A) Whitish colonies with zonate growth pattern on PDA plate. The mycelia are ceonocytic from which arise erect sporangiophores bearing terminal globose saporangia (B) the evolutionary history based on ITS1-5.8S-ITS2 ribosomal gene sequence was inferred by using the Maximum Likelihood method based on the Tamura-Nei model30. The tree is drawn to scale, with branch lengths measured in the number of substitutions per site. The analysis involved 9 nucleotide sequences and (C) time course accumulation of biomass and phytohormone (indole acetic acid) produced by the endophyte over a period of three weeks.
