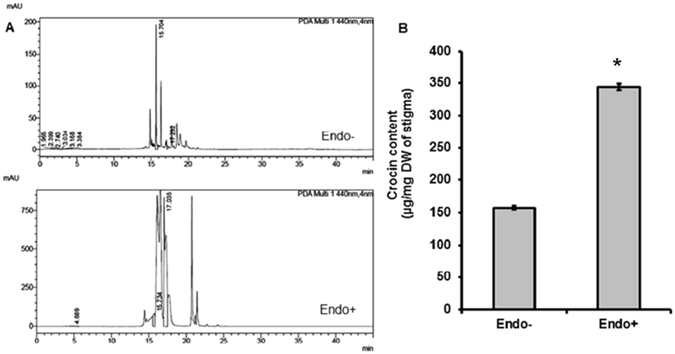
Figure 2.

Effect of the CS10E4 on crocin content of saffron. (A) HPLC chromatograms showing crocin peaks in endophyte free (Endo−) and endophyte treated (Endo+) Crocus stigma samples (B) Bar diagram showing crocin content (µg/mg dry weight of stigma) in endophyte treated and control plants. Values are the means ± S.D. Comparisons among means were carried out using Student T test at a significance level of P ≤ 0.05 using GraphPad InStat tm software (V2.05).
