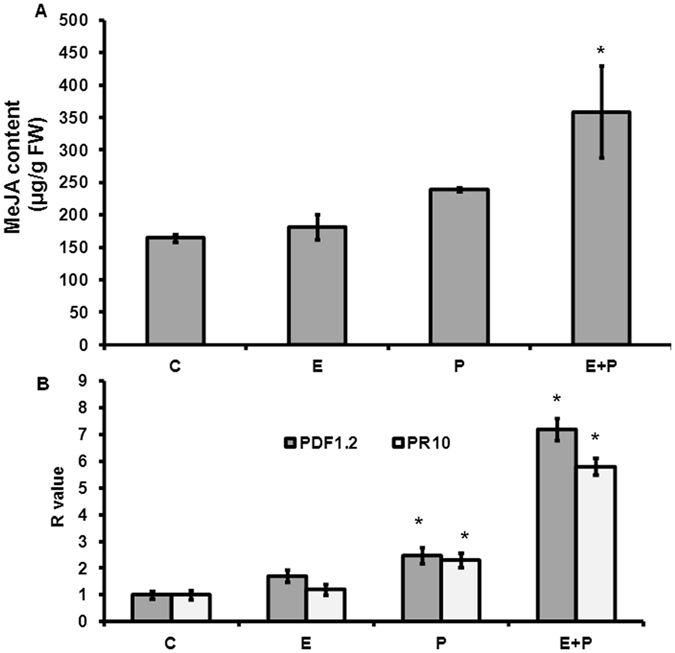
Figure 5.

Quantification of jasmonic acid (JA) content and expression of JA responsive genes in Crocus corms. (A) Bar diagram shows JA content (µg/g fresh weight) in Crocus corms for all the four treatment conditions. (B) Transcript abundance of PDF 1.2 and PR10 genes in Crocus corms. where, C means control (endophyte free plants), E means only endophyte (CS10E4) treatment, P means only pathogen (F. oxysporum R1) treatment and E + P means pathogen treatment 3dpi of endophyte. 18 S was used as the internal reference gene. Data are means ± SD from three biological replicates. *Represents significance at P ≤ 0.05 using GraphPad InStat tm software (V2.05).
