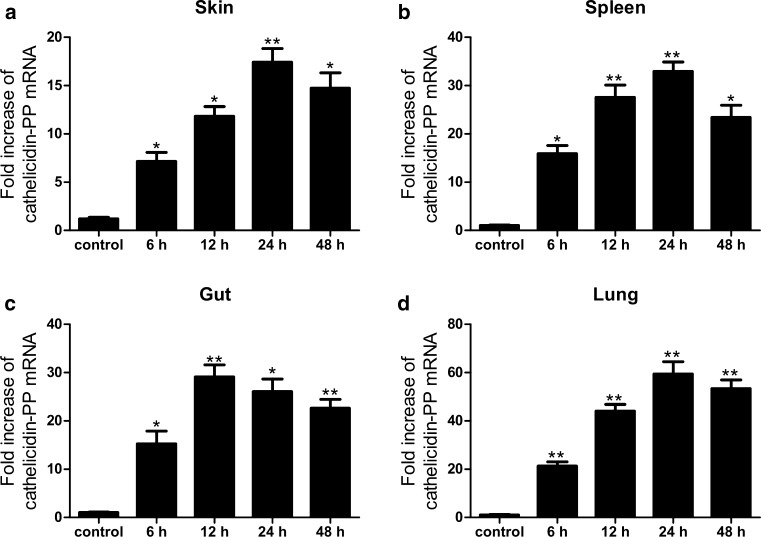
Fig. 11.
Fold increase of cathelicidin-PP in immune-related tissues at different time courses after immune challenge with E. coli. a Fold increase of cathelicidin-PP in skin. b Fold increase of cathelicidin-PP in spleen. c Fold increase of cathelicidin-PP in gut. d Fold increase of cathelicidin-PP in lung. Expression levels in different tissues were calculated relative to the level of cathelicidin-PP in corresponding uninfected tissue, which was arbitrarily defined as 1. Values for infection treatment are significantly different from control values. *p < 0.05, **p < 0.01, significantly different compared to the control (n = 5)

